Categories
Real Estate Market StatisticsPublished September 16, 2025
Central Texas Housing Shows Balance with Stable Prices

Central Texas housing market shows balance with stable prices and increasing pending sales
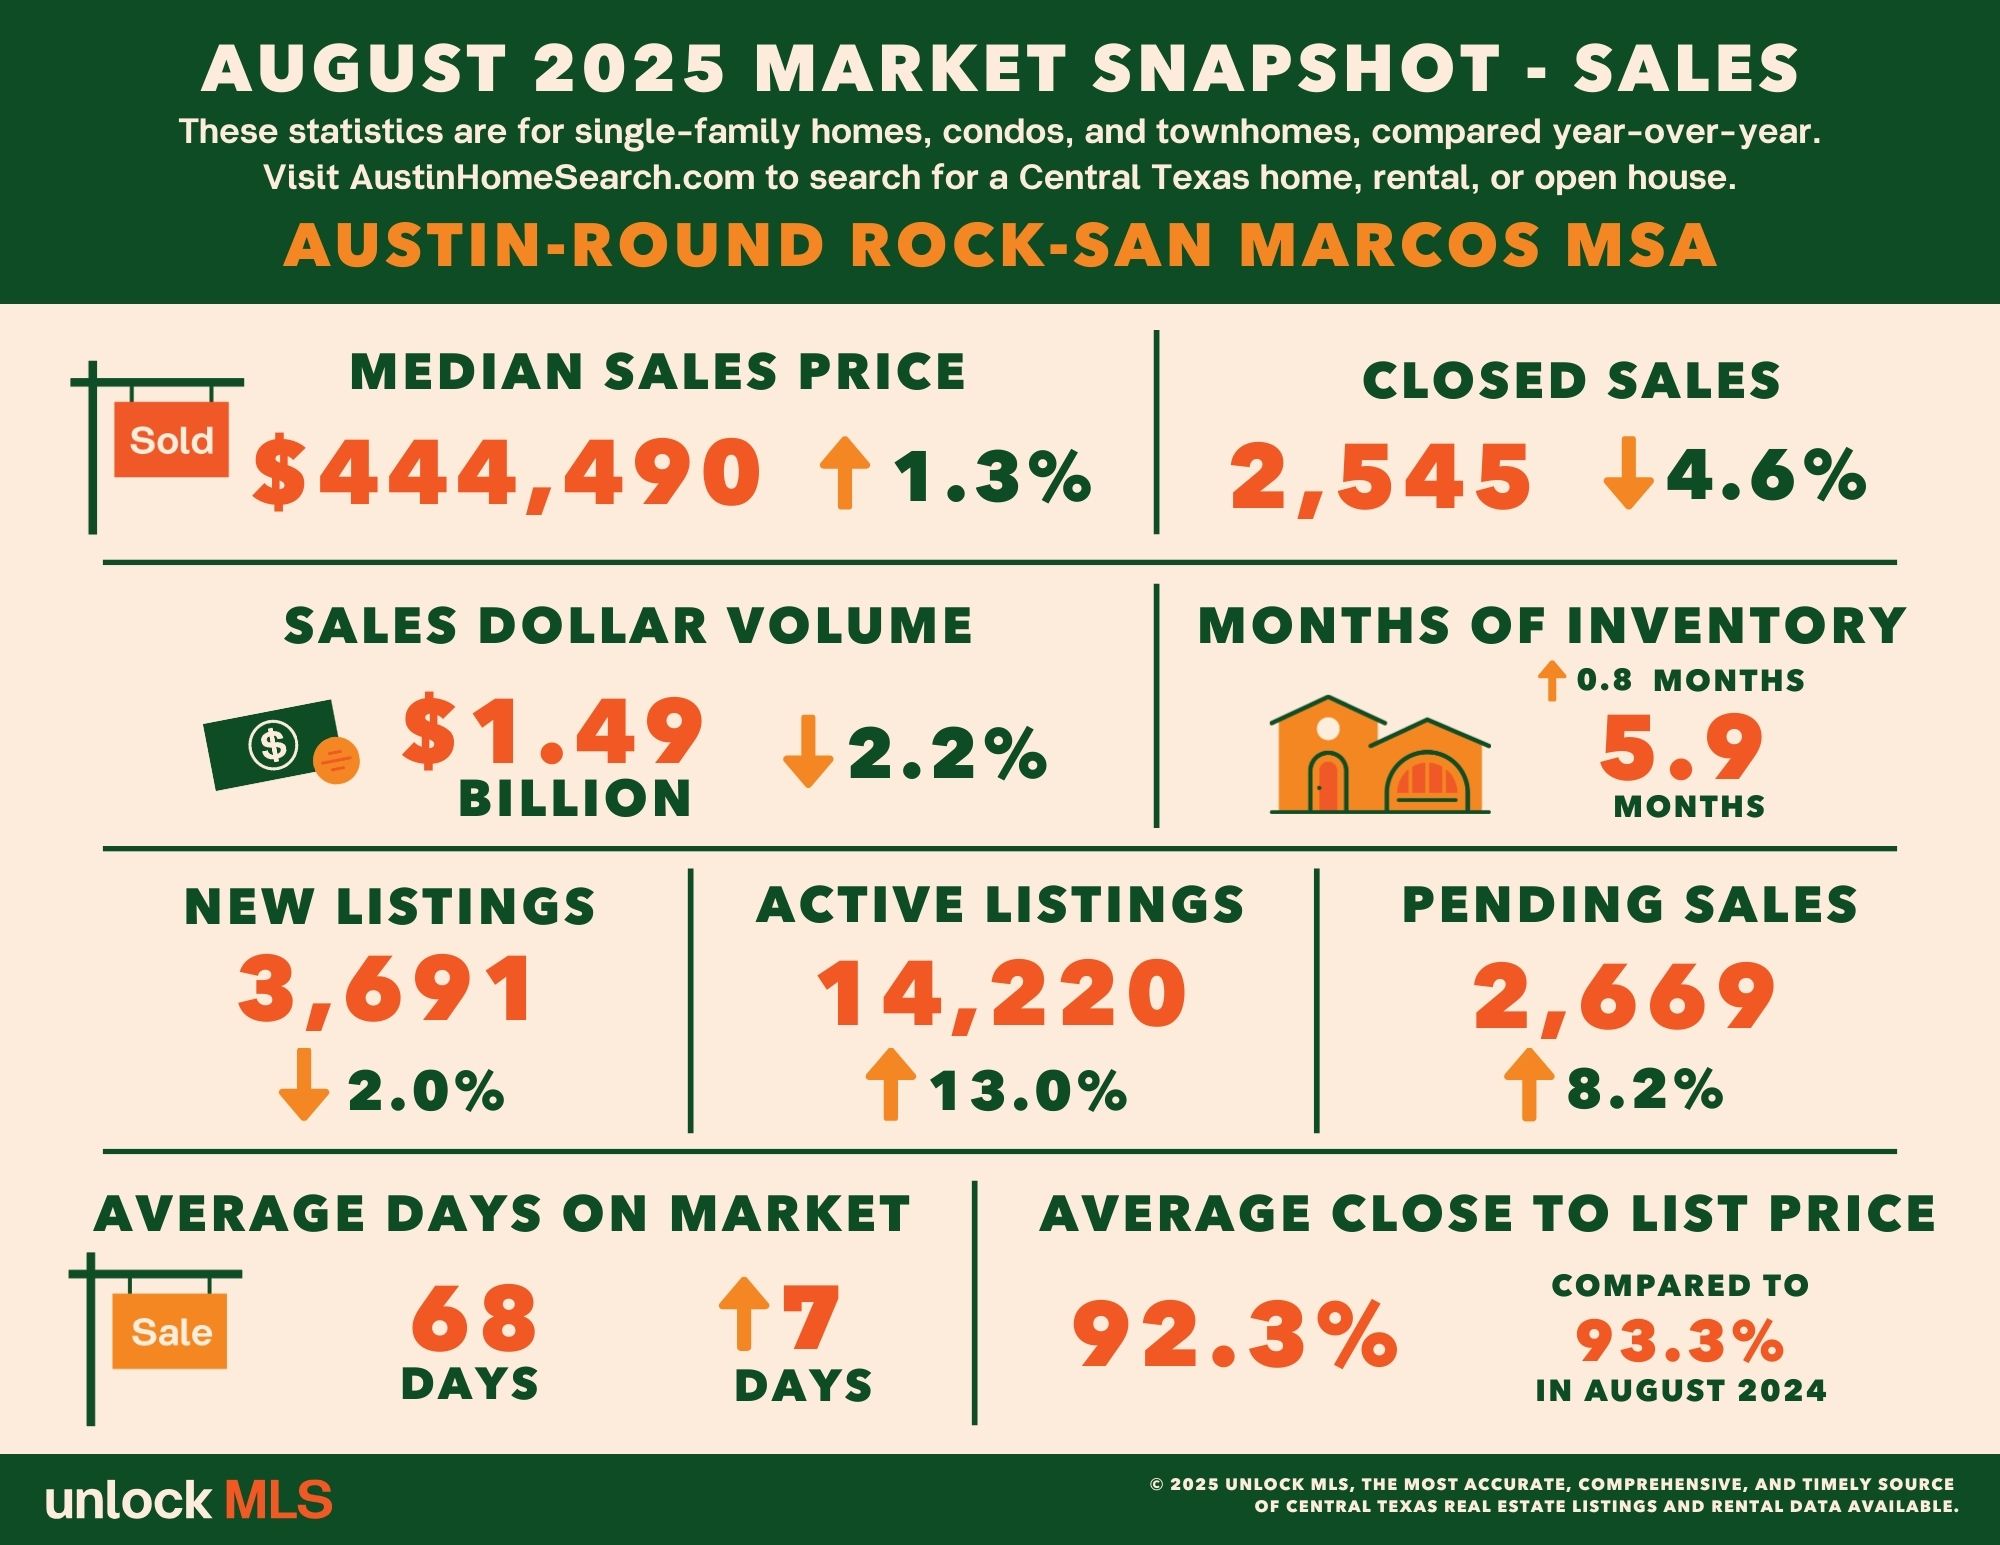
AUSTIN, Texas — The latest Central Texas Housing Report from Unlock MLS shows encouraging momentum as the market heads into fall. Pending sales in the Austin–Round Rock–San Marcos area increased 8.2% in August, marking the fourth straight month of year-over-year growth and underscoring steady buyer demand. The median home price held firm at $444,490, showing a modest uptick from the same time last year. Active listings rose 13% year-over-year to 14,220, though monthly figures have begun to ease, keeping inventory below six months and pointing to a more balanced housing environment.
According to Vaike O’Grady, research advisor at Unlock MLS, the numbers reflect what’s typical for this stage of the market cycle.
“We’re seeing pending sales climb, home prices remain consistent, and inventory trend in a positive direction,” O’Grady noted. “August’s data points to renewed buyer confidence even with overall sales volume easing. If the Fed moves forward with a rate cut as expected, affordability could improve and spark stronger activity, especially for buyers considering adjustable-rate mortgages that react more quickly to such changes.”
Brandy Wuensch, president of Unlock MLS and ABoR for 2025, highlighted key takeaways from the recent Central Texas Housing Summit, where regional experts discussed the future of the market and the important role REALTORS® play.
“We’re observing a more steady and balanced marketplace, which benefits both buyers and sellers,” Wuensch explained. “Consumers have largely adjusted to current interest rates, meaning success depends on strategy and preparation, not just rate shifts. Working with a REALTOR® provides the insights and tools needed to compete effectively—whether that’s navigating mortgage options, understanding timing, or aligning with market trends. Having the right guidance is critical to achieving your goals in this environment.”
Austin-Round Rock-San Marcos MSA
August 2025 - For Sale
-
2,545 – Residential homes sold, 4.6% less than August 2024.
-
$444,490 – Median price for residential homes, 1.3% more than August 2024.
-
3,691 – New home listings on the market, 2.0% less than August 2024.
-
14,220 – Active home listings on the market, 13.0% more than August 2024.
-
2,669 – Pending sales, 8.2% more than August 2024.
-
5.9 – Months of inventory, 0.8 months more than August 2024.
-
$1,494,706,098 – Total dollar volume of homes sold, 2.2% less than August 2024.
-
92.3% – Average close to list price, compared to 93.3% in August 2024.
August 2025 - For Lease
-
2,362 – Closed leases, 10.9% less than August 2024.
-
$2,362– Median price for rent, 5.0% more than August 2024.
-
3,113 – New lease listings on the market, 0.4% less than August 2024.
-
5,786 – Active lease listings on the market, 1.1% less than August 2024.
-
2,159 – Pending leases, 5.1% more than August 2024.
-
2.6 – Months of inventory, 0.1 months less than August 2024
-
$6,167,961 – Total dollar volume of leases, 7.7% less than August 2024.
-
96.1% – Average close to list price, compared to 99.7% in August 2024.
City of Austin
August 2025 - For Sale
-
901 – Residential homes sold, 2.0% more than August 2024.
-
$590,000 – Median price for residential homes, 1.7% more than August 2024.
-
1,263 – New home listings on the market, 0.6% more than August 2024.
-
5,163 – Active home listings on the market, 11.5% more than August 2024.
-
934 – Pending sales, 16.3% more than August 2024.
-
6.3 – Months of inventory, 0.7 months more than August 2024.
-
$696,515,302 – Total dollar volume of homes sold, 4.3% more than August 2024.
-
91.6% – Average close to list price, compared to 92.3% in August 2024.
August 2025 - For Lease
-
1,141 – Closed leases, 16.7% less than August 2024.
-
$2,450 – Median price for rent, 7.5% less than August 2024.
-
1,482 – New lease listings on the market, 0.1% more than August 2024.
-
2,719 – Active lease listings on the market, 6.8% less than August 2024.
-
1,189 – Pending leases, 4.4% less than August 2024.
-
2.6 – Months of inventory, 0.2 months less than August 2024.
-
$3,389,809 – Total dollar volume of leases, 8.6% less than August 2024.
-
95.9% – Average close to list price, compared to 94.1% in August 2024.
Travis County
August 2025 - For Sale
-
1,167 – Residential homes sold, 2.7% less than August 2024.
-
$525,000 – Median price for residential homes, 4.4% more than August 2024.
-
1,754 – New home listings on the market, 4.0% more than August 2024.
-
6,943 – Active home listings on the market, 13.2% more than August 2024.
-
1,199 – Pending sales, 11.8% more than August 2024.
-
6.9 – Months of inventory, 0.8 months more than August 2024.
-
$842,107,565 – Total dollar volume of homes sold, 1.3% more than August 2024.
-
93.0% – Average close to list price, compared to 93.3% in August 2024.
August 2025 - For Lease
-
1,303 – Closed leases, 13.7% less than August 2024.
-
$2,350 – Median price for rent, 2.1% less than August 2024.
-
1,706 – New lease listings on the market, 1.3% less than August 2024.
-
3,190 – Active lease listings on the market, 5.9% less than August 2024.
-
1,391 – Pending leases, 1.5% more than August 2024.
-
2.6 – Months of inventory, 0.2 months less than August 2024.
-
$3,757,371 – Total dollar volume of leases, 8.3% less than August 2024.
-
96.1% – Average close to list price, compared to 94.4% in August 2024.
Williamson County
August 2025 - For Sale
-
858 – Residential homes sold, 4.1% less than August 2024.
-
$425,000 – Median price for residential homes, 0.6% less than August 2024.
-
1,244 – New home listings on the market, 2.0% less than August 2024.
-
4,523– Active home listings on the market, 20.8% more than August 2024.
-
913 – Pending sales, 6.7% more than August 2024.
-
5.4 – Months of inventory, 1.1 months more than August 2024.
-
$416,276,160 – Total dollar volume of homes sold, 5.8% less than August 2024.
-
93.3% – Average close to list price, compared to 93.9% in August 2024.
August 2025 - For Lease
-
807 – Closed leases, 9.8% less than August 2024.
-
$2,150 – Median price for rent, 2.2% less than August 2024.
-
1,040 – New lease listings on the market, 0.2% more than August 2024.
-
1,916 – Active lease listings on the market, 4.0% more than August 2024.
-
811 – Pending leases, 8.0% more than August 2024.
-
2.3 – Months of inventory, 0.2 months more than August 2024.
-
$1,847,742 – Total dollar volume of leases, 5.3% less than August 2024.
-
96.1% – Average close to list price, compared to 96.0% in August 2024.
Hays County
August 2025 - For Sale
-
401– Residential homes sold, 5.4% less than August 2024.
-
$369,000 – Median price for residential homes, 3.4% less than August 2024.
-
481 – New home listings on the market, 15.8% less than August 2024.
-
1,831 – Active home listings on the market, 3.0% less than August 2024.
-
416 – Pending sales, 4.5% more than August 2024.
-
4.8 – Months of inventory, 0.1 months less than August 2024.
-
$195,645,957 – Total dollar volume of homes sold, 2.7% less than August 2024.
-
92.0% – Average close to list price, compared to 93.6% in August 2024.
August 2025 - For Lease
-
184 – Closed leases, 22.0% less than August 2024.
-
$2,000 – Median price for rent, 13.0% less than August 2024.
-
286 – New lease listings on the market, 1.8% more than August 2024.
-
536 – Active lease listings on the market, 11.4% more than August 2024.
-
192 – Pending leases, 5.9% less than August 2024.
-
2.7 – Months of inventory, 0.3 months more than August 2024.
-
$432,176 – Total dollar volume of leases, 20.4% less than August 2024.
-
96.1% – Average close to list price, compared to 95.4% in August 2024.
Bastrop County
August 2025 - For Sale
-
102 – Residential homes sold, 7.4% more than August 2024.
-
$366,000 – Median price for residential homes, 16.6% less than August 2024.
-
175 – New home listings on the market, 8.4% less than August 2024.
-
774 – Active home listings on the market, 13.8% more than August 2024.
-
112 – Pending sales, 21.7% more than August 2024.
-
7.4 – Months of inventory, 1.0 months more than August 2024.
-
$37,411,097 – Total dollar volume of homes sold, 5.4% less than August 2024.
-
92.7% – Average close to list price, compared to 93.1% in August 2024.
August 2025 - For Lease
-
47 – Closed leases, 42.4% more than August 2024.
-
$2,100 – Median price for rent, 0.2% more than August 2024.
-
61 – New lease listings on the market, 1.7% more than August 2024.
-
105 – Active lease listings on the market, 7.1% less than August 2024.
-
44 – Pending leases, 51.7% more than August 2024.
-
3.3 – Months of inventory, 0.3 months more than August 2024.
-
$98,130 – Total dollar volume of leases, 46.5% more than August 2024.
-
98.0% – Average close to list price, compared to 95.7% in August 2024.
Caldwell County
August 2025 - For Sale
-
30 – Residential homes sold, 38.8% less than August 2024.
-
$227,750– Median price for residential homes, 24.1% less than August 2024.
-
37 – New home listings on the market, 24.5% less than August 2024.
-
156 – Active home listings on the market, 6.1% more than August 2024.
-
30 – Pending sales, 37.5% more than August 2024.
-
4.5 – Months of inventory, 0.9 months more than August 2024.
-
$8,054,305 – Total dollar volume of homes sold, 45.8% less than August 2024.
-
90.2% – Average close to list price, compared to 95.6% in August 2024.
August 2025 - For Lease
-
22 – Closed leases, 83.3% more than August 2024.
-
$1,700 – Median price for rent, 0.3% more than August 2024.
-
21 – New lease listings on the market, 5.0% more than August 2024.
-
39 – Active lease listings on the market, 56.0% more than August 2024.
-
21 – Pending leases, 5.0% more than August 2024.
-
2.7 – Months of inventory, 1.0 months more than August 2024.
-
$35,962 – Total dollar volume of leases, 65.5% more than August 2024.
-
94.5% – Average close to list price, compared to 97.5% in August 2024.
Source: UnlockMLS
|


or another way