
Categories
Real Estate Market StatisticsPublished August 15, 2025
Housing Activity in Central Texas Aligns with Summer Trends

Housing Activity in Central Texas Aligns with Summer Trends
Source: UnlockMLS
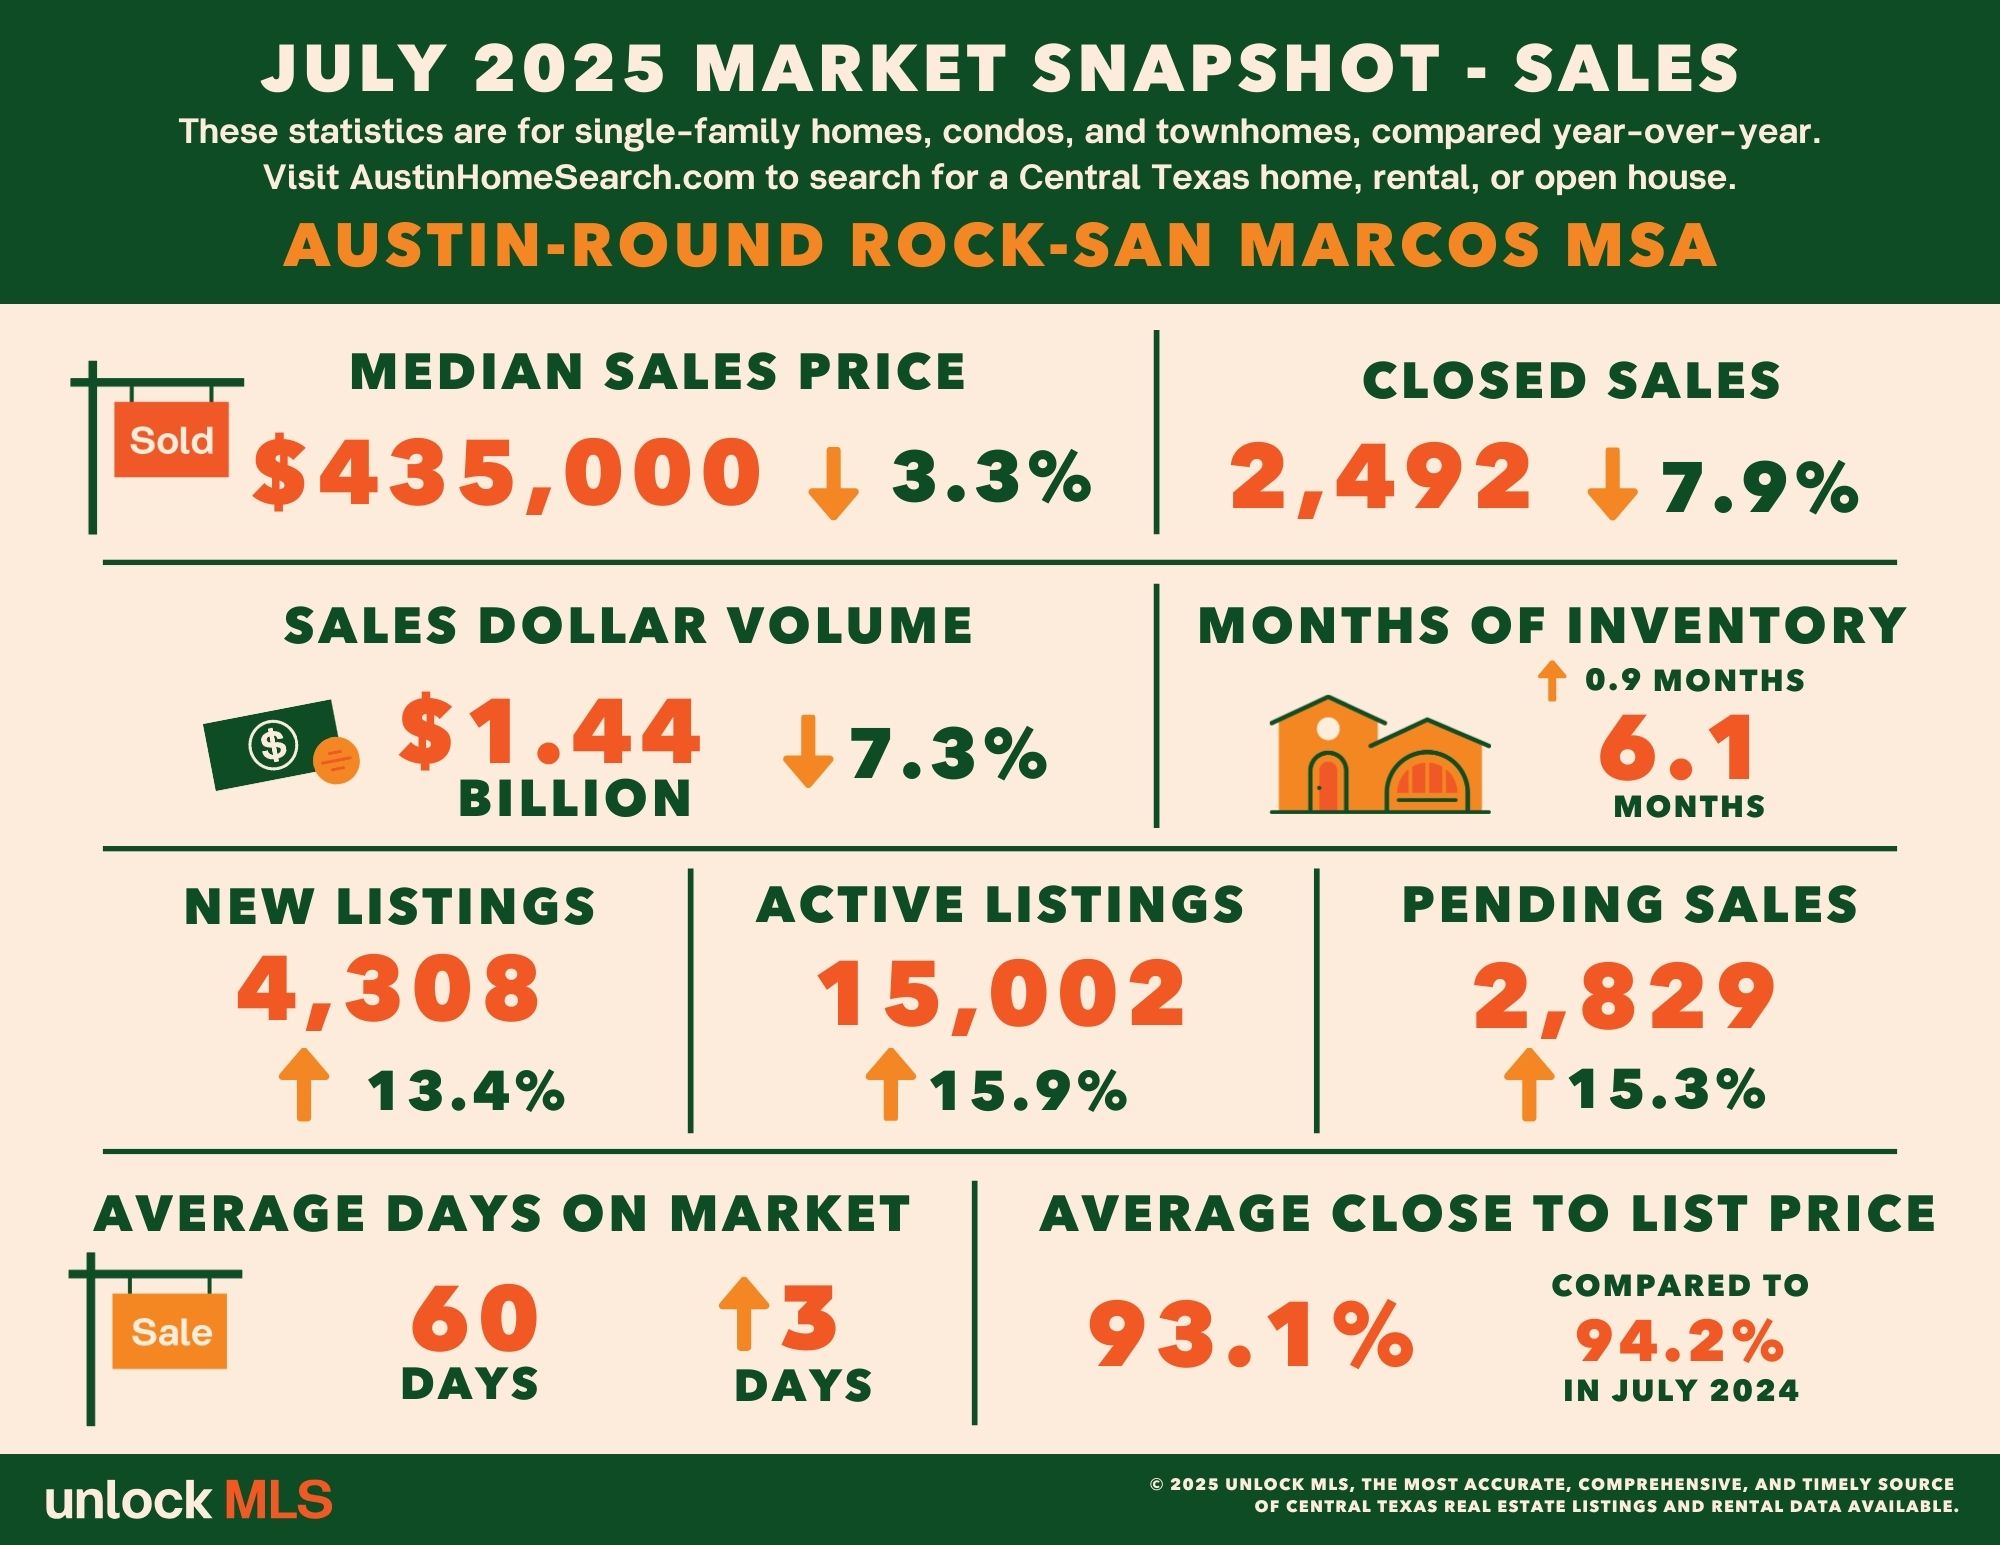
AUSTIN, Texas — The latest Central Texas Housing Report from Unlock MLS shows that the Austin-Round Rock-San Marcos MSA saw 2,492 home sales in July, a 7.9% drop compared to the same month last year. The median sales price stood at $435,000. The market mirrored typical summer patterns—sales activity slowed and prices adjusted slightly—while inventory levels remained higher than in 2024, despite a slight decrease from June. Pending sales jumped over 15%, suggesting momentum heading into the fall season.
Unlock MLS research advisor Vaike O’Grady explained that the housing market’s performance this summer aligns with expectations, reflecting seasonal trends amid continued economic growth in Central Texas.
“Summers often bring a slowdown in real estate activity as many focus on vacations and leisure,” O’Grady said. “Once the school year begins, the market usually regains pace. It’s promising to see year-over-year growth in pending transactions. Buyers now have more options than in recent years due to higher inventory, but the month-to-month decline in listings could indicate that some sellers are waiting. A drop in interest rates this fall might encourage more movement on both sides of the market.”
Brandy Wuensch, president of Unlock MLS and ABoR for 2025, emphasized the importance of professional guidance for both buyers and sellers.
“With Austin’s consistent ranking among the best places to live in the country, opportunities remain strong for both buyers and renters,” Wuensch said. “For buyers, a slower-paced market can provide an advantage, while sellers with well-priced homes are still seeing quick sales. Working with a skilled REALTOR® can help you navigate the market’s complexities and achieve the best results.”
Austin-Round Rock-San Marcos MSA
-
July 2025 - For Sale
-
2,492 – Residential homes sold, 7.9% less than July 2024.
-
$435,000 – Median price for residential homes, 3.3% less than July 2024.
-
4,308 – New home listings on the market, 13.4% more than July 2024.
-
15,002 – Active home listings on the market, 15.9% more than July 2024.
-
2,829 – Pending sales, 15.3% more than July 2024.
-
6.1 – Months of inventory, 0.9 months more than July 2024.
-
$1,440,357,791 – Total dollar volume of homes sold, 7.3% less than July 2024.
-
93.1% – Average close to list price, compared to 94.2% in July 2024.
-
July 2025 - For Lease
-
2,701 – Closed leases, 6.4% less than July 2024.
-
$2,295 – Median price for rent, 0.2% less than July 2024.
-
3,671 – New lease listings on the market, 0.5% less than July 2024.
-
5,741 – Active lease listings on the market, 0.9% less than July 2024.
-
2,873 – Pending leases, 2.5% more than July 2024.
-
2.0 – Months of inventory, flat compared to July 2024
-
$7,055,985 – Total dollar volume of leases, 5.4% less than July 2024.
-
99.7% – Average close to list price, compared to 99.9% in July 2024.
City of Austin
-
July 2025 - For Sale
-
884 – Residential homes sold, 1.7% less than July 2024.
-
$590,000 – Median price for residential homes, 2.2% more than July 2024.
-
1,550 – New home listings on the market, 14.1% more than July 2024.
-
5,673 – Active home listings on the market, 14.5% more than July 2024.
-
981 – Pending sales, 22.2% more than July 2024.
-
6.9 – Months of inventory, 1.0 months more than July 2024.
-
$672,958,414 – Total dollar volume of homes sold, flat compared to July 2024.
-
93.8% – Average close to list price, compared to 92.9% in July 2024.
-
July 2025 - For Lease
-
1,359 – Closed leases, 8.9% less than July 2024.
-
$2,795 – Median price for rent, 1.6% more than July 2024.
-
1,754 – New lease listings on the market, 3.4% less than July 2024.
-
2,725 – Active lease listings on the market, 10.7% less than July 2024.
-
1,441 – Pending leases, 1.5% more than July 2024.
-
2.0 – Months of inventory, flat compared to July 2024.
-
$3,932,036 – Total dollar volume of leases, 6.7% less than July 2024.
-
99.8% – Average close to list price, compared to 99.5% in July 2024.
Travis County
-
July 2025 - For Sale
-
1,121 – Residential homes sold, 4.7% less than July 2024.
-
$525,000 – Median price for residential homes, 1.0% more than July 2024.
-
1,993 – New home listings on the market, 12.5% more than July 2024.
-
7,437 – Active home listings on the market, 14.5% more than July 2024.
-
1,260 – Pending sales, 15.6% more than July 2024.
-
6.9 – Months of inventory, 0.8 months more than July 2024.
-
$800,560,074 – Total dollar volume of homes sold, 2.3% less than July 2024.
-
93.0% – Average close to list price, compared to 93.9% in July 2024.
-
July 2025 - For Lease
-
1,536 – Closed leases, 9.4% less than July 2024.
-
$2,400 – Median price for rent, 2.4% less than July 2024.
-
2,025 – New lease listings on the market, 1.8% less than July 2024.
-
3,096 – Active lease listings on the market, 5.4% less than July 2024.
-
1,630 – Pending leases, 2.3% more than July 2024.
-
2.0 – Months of inventory, flat compared to July 2024.
-
$4,348,974 – Total dollar volume of leases, 8.2% less than July 2024.
-
96.0% – Average close to list price, compared to 96.5% in July 2024.
Williamson County
-
July 2025 - For Sale
-
850 – Residential homes sold, 11.1% less than July 2024.
-
$419,995 – Median price for residential homes, 1.6% less than July 2024.
-
1,488 – New home listings on the market, 18.3% more than July 2024.
-
4,651 – Active home listings on the market, 25.3% more than July 2024.
-
936 – Pending sales, 12.2% more than July 2024.
-
5.5 – Months of inventory, 1.3 months more than July 2024.
-
$406,626,407 – Total dollar volume of homes sold, 12.8% less than July 2024.
-
93.3% – Average close to list price, compared to 94.6% in July 2024.
-
July 2025 - For Lease
-
850 – Closed leases, 11.1% less than July 2024.
-
$2,200 – Median price for rent, 1.1% less than July 2024.
-
1,236 – New lease listings on the market, 1.6% less than July 2024.
-
1,894 – Active lease listings on the market, 8.0% more than July 2024.
-
946 – Pending leases, 5.7% more than July 2024.
-
2.0 – Months of inventory, flat compared to July 2024.
-
$2,041,034 – Total dollar volume of leases, 0.8% less than July 2024.
-
97.0% – Average close to list price, flat compared to July 2024.
Hays County
-
July 2025 - For Sale
-
363 – Residential homes sold, 11.9% less than July 2024.
-
$365,000 – Median price for residential homes, 4.6% less than July 2024.
-
585 – New home listings on the market, 7.5% more than July 2024.
-
1,974 – Active home listings on the market, 2.9% more than July 2024.
-
469 – Pending sales, 26.4% more than July 2024.
-
5.2 – Months of inventory, 0.2 months more than July 2024.
-
$177,111,723 – Total dollar volume of homes sold, 13.3% less than July 2024.
-
92.6% – Average close to list price, compared to 94.3% in July 2024.
-
July 2025 - For Lease
-
229 – Closed leases, 7.7% less than July 2024.
-
$2,350 – Median price for rent, 2.2% more than July 2024.
-
317 – New lease listings on the market, 5.3% more than July 2024.
-
505 – Active lease listings on the market, 15.3% more than July 2024.
-
231 – Pending leases, 10.1% less than July 2024.
-
2.0 – Months of inventory, flat compared to July 2024.
-
$545,942 – Total dollar volume of leases, 2.8% less than July 2024.
-
97.5% – Average close to list price, compared to 96.7% in July 2024.
Bastrop County
-
July 2025 - For Sale
-
116 – Residential homes sold, 3.3% less than July 2024.
-
$336,749 – Median price for residential homes, 2.7% less than July 2024.
-
187 – New home listings on the market, 10.0% more than July 2024.
-
786 – Active home listings on the market, 19.6% more than July 2024.
-
115 – Pending sales, 0.9% less than July 2024.
-
7.5 – Months of inventory, 0.1 months more than July 2024.
-
$42,344,395 – Total dollar volume of homes sold, 14.0% less than July 2024.
-
93.9% – Average close to list price, compared to 94.4% in July 2024.
-
July 2025 - For Lease
-
44 – Closed leases, 18.9% more than July 2024.
-
$2,000 – Median price for rent, 1.2% less than July 2024.
-
61 – New lease listings on the market, 14.1% less than July 2024.
-
116 – Active lease listings on the market, 13.7% more than July 2024.
-
49 – Pending leases, 19.5% more than July 2024.
-
3.0 – Months of inventory, flat compared to July 2024.
-
$94,615 – Total dollar volume of leases, 29.8% more than July 2024.
-
96.8% – Average close to list price, compared to 97.4% in July 2024.
Caldwell County
-
July 2025 - For Sale
-
39 – Residential homes sold, 4.9% less than July 2024.
-
$300,000 – Median price for residential homes, 0.8% less than July 2024.
-
58 – New home listings on the market, 3.6% more than July 2024.
-
166 – Active home listings on the market, 3.8% more than July 2024.
-
49 – Pending sales, 14.0% more than July 2024.
-
4.5 – Months of inventory, 0.5 months more than July 2024.
-
$13,136,492 – Total dollar volume of homes sold, 6.9% less than July 2024.
-
92.3% – Average close to list price, compared to 95.6% in July 2024.
-
July 2025 - For Lease
-
14 – Closed leases, 17.6% less than July 2024.
-
$1,823 – Median price for rent, 1.3% less than July 2024.
-
23 – New lease listings on the market, 130.0% more than July 2024.
-
39 – Active lease listings on the market, 95.0% more than July 2024.
-
18 – Pending leases, 20.0% more than July 2024.
-
3.0 – Months of inventory, 2.0 months more than July 2024.
-
$25,420 – Total dollar volume of leases, 17.1% less than July 2024.
-
98.6% – Average close to list price, compared to 96.0% in July 2024.
For more information or to download the July 2025 Central Texas Housing Market Report, visit UnlockMLS.com/Stats.
Source: UnlockMLS
|


or another way