
Categories
All About Texas, Real Estate Market StatisticsPublished December 16, 2025
November Pending Sales Signal Steady Buyer Interest in Central Texas

November Pending Sales Signal Steady Buyer Interest in Central Texas
Source: UnlockMLS
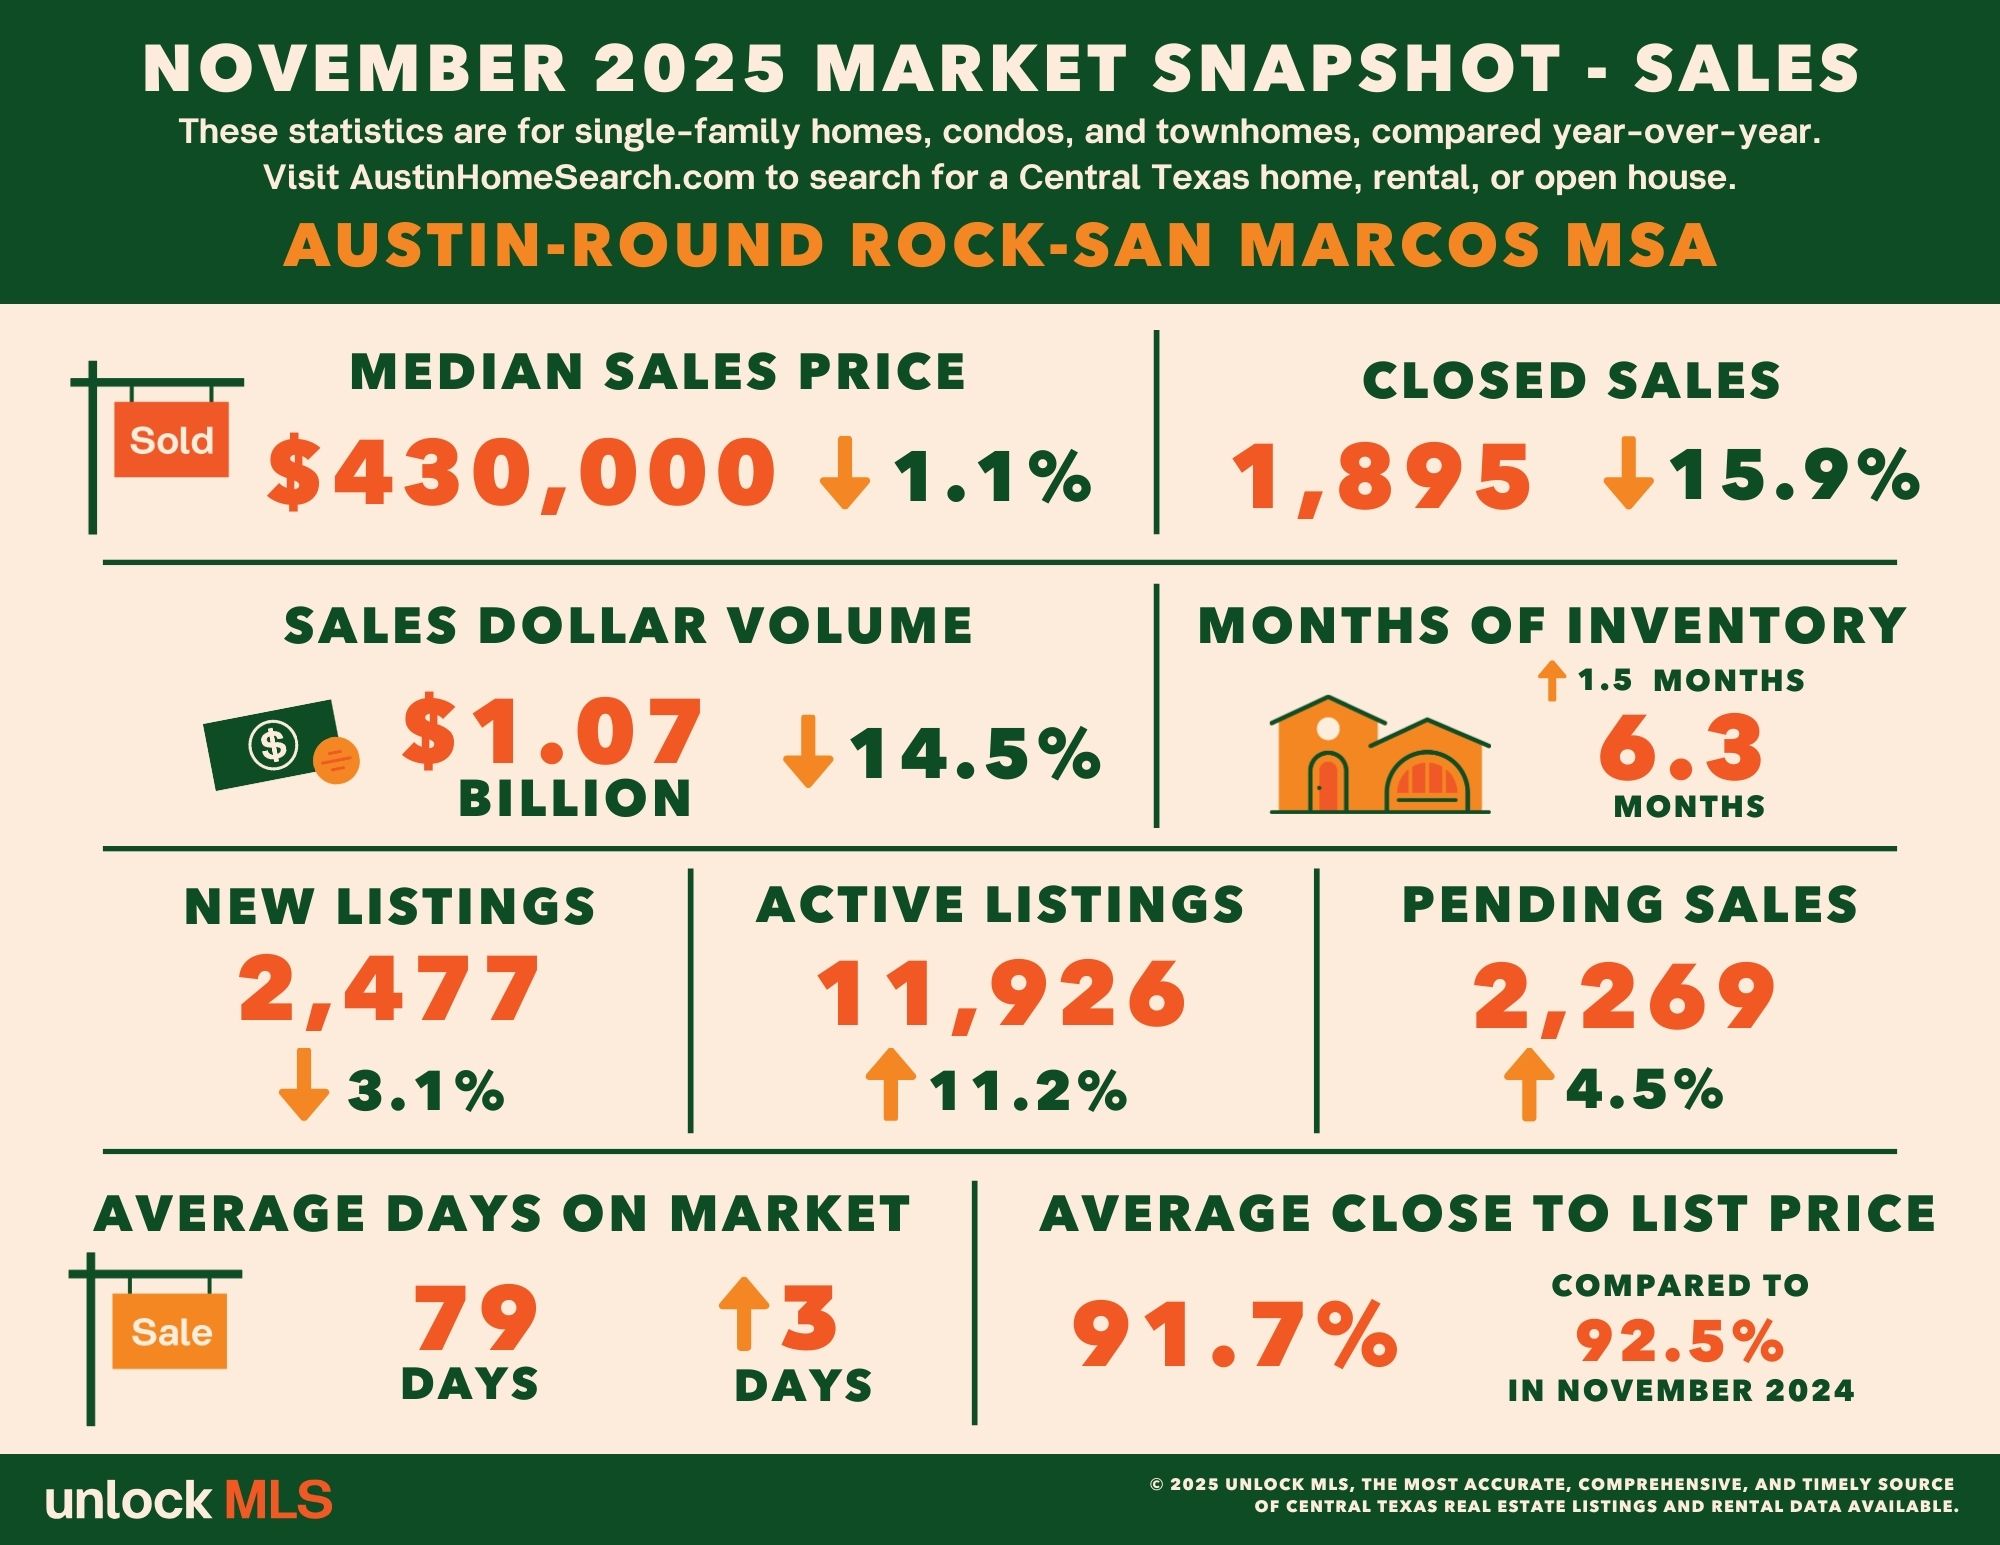
AUSTIN, Texas — The Central Texas housing market showed signs of stability in November, according to the November 2025 Central Texas Housing Report from Unlock MLS. Pending home sales across the Austin–Round Rock–San Marcos metro area increased 4.5% year over year, totaling 2,269 contracts. At the same time, housing supply expanded to 6.3 months of inventory, the highest level seen in more than a year.
Home prices remained relatively flat, with the median sales price slipping 1.1% from last year to $430,000. Closed sales, however, declined notably, dropping 15.9% to 1,895 completed transactions.
Vaike O’Grady, market research advisor for Unlock MLS, noted that last year’s numbers were influenced by unusual conditions. November 2024 activity surged following the Federal Reserve’s first interest rate cut, which led to a short-term boost in buyer demand. “When compared to that spike, this year’s decline in closed sales appears more dramatic than it would under normal circumstances,” O’Grady said. She also pointed out that October’s government shutdown likely delayed some transactions into later months.
Despite the slowdown in closings, O’Grady emphasized that the increase in pending sales is a positive indicator, suggesting that serious buyers are returning to the market. She added that the Federal Reserve’s most recent rate cut could help strengthen buyer confidence as the market heads into 2026. “As mortgage rates level out and consumers adapt to the current environment, we expect activity to gradually pick up. Central Texas continues to benefit from strong long-term fundamentals that help cushion seasonal and economic fluctuations,” she said.
Brandy Wuensch, 2025 president of Unlock MLS and the Austin Board of REALTORS®, echoed that sentiment, noting that even during a traditionally slower period, opportunities remain for both buyers and sellers.
“Inventory levels are rising, pricing has stabilized and buyers are approaching the market more thoughtfully,” Wuensch said. “REALTORS® are essential in helping Central Texans make informed decisions during this transition. This is a time for smart positioning, not fear. Buyers now have more choices, and sellers must align pricing with today’s market realities. While the pace has cooled, the Austin-area housing market remains fundamentally sound.”
Austin-Round Rock-San Marcos MSA
November 2025 - For Sale
- 1,895 – Residential homes sold, 15.9% less than November 2024.
- $430,000 – Median price for residential homes, 1.1% less than November 2024.
- 2,477 – New home listings on the market, 3.1% less than November 2024.
- 11,926 – Active home listings on the market, 11.2% more than November 2024.
- 2,269 – Pending sales, 4.5% more than November 2024.
- 6.3 – Months of inventory, 1.5 months more than November 2024.
- $1,078,709,812 – Total dollar volume of homes sold, 14.5% less than November 2024.
- 91.7% – Average close to list price, compared to 92.5% in November 2024.
November 2025 - For Lease
- 1,650 – Closed leases, 13.2% less than November 2024.
- $2,100 – Median price for rent, 2.3 less than November 2024.
- 1,918 – New lease listings on the market, 5.7% less than November 2024.
- 5,401 – Active lease listings on the market, 4.7% more than November 2024.
- 1,722 – Pending leases, 6.8% less than November 2024.
- 3.0 – Months of inventory, flat compared to November 2024.
- $4,011,037 – Total dollar volume of leases, 12.2% less than November 2024.
- 94.0% – Average close to list price, compared to 93.6% in November 2024.
City of Austin
November 2025 - For Sale
- 655 – Residential homes sold, 7.1% less than November 2024.
- $565,000 – Median price for residential homes, 1.5% less than November 2024.
- 793 – New home listings on the market, 4.6% less than November 2024.
- 4,064 – Active home listings on the market, 6.9% more than November 2024.
- 753 – Pending sales, 5.5% more than November 2024.
- 4.9 – Months of inventory, 0.3 months more than November 2024.
- $467,982,112 – Total dollar volume of homes sold, 12.7% less than November 2024.
- 91.8% – Average close to list price, compared to 91.6% in November 2024.
November 2025 - For Lease
- 762 – Closed leases, 13.0% less than November 2024.
- $2,300 – Median price for rent, flat compared to November 2024.
- 888 – New lease listings on the market, 7.9% less than November 2024.
- 2,596 – Active lease listings on the market, 1.2% more than November 2024.
- 818 – Pending leases, 6.2% less than November 2024.
- 3.0 – Months of inventory, flat compared to November 2024.
- $2,072,916 – Total dollar volume of leases, 11.2% less than November 2024.
- 93.8% – Average close to list price, compared to 93.4% in November 2024.
Travis County
November 2025 - For Sale
- 867 – Residential homes sold, 8.3% less than November 2024.
- $505,000 – Median price for residential homes, 1.0% less than November 2024.
- 1,126 – New home listings on the market, 1.9% less than November 2024.
- 5,632 – Active home listings on the market, 9.4% more than November 2024.
- 996 – Pending sales, 2.5% more than November 2024.
- 5.2 – Months of inventory, 0.5 months more than November 2024.
- $588,818,555 – Total dollar volume of homes sold, 9.7% less than November 2024.
- 91.9% – Average close to list price, compared to 92.1% in November 2024.
November 2025 - For Lease
- 908 – Closed leases, 9.0% less than November 2024.
- $2,300 – Median price for rent, flat compared to November 2024.
- 1,099 – New lease listings on the market, 3.3% less than November 2024.
- 3,100 – Active lease listings on the market, 2.4% more than November 2024.
- 959 – Pending leases, 3.3% less than November 2024.
- 3.0 – Months of inventory, flat compared to November 2024.
- $2,404,296 – Total dollar volume of leases, 8.6% less than November 2024.
- 93.9% – Average close to list price, compared to 93.5% in November 2024.
Williamson County
November 2025 - For Sale
- 661 – Residential homes sold, 17.1% less than November 2024.
- $415,000 – Median price for residential homes, 3.5% less than November 2024.
- 791 – New home listings on the market, 6.7% more than November 2024.
- 3,717– Active home listings on the market, 20.1% more than November 2024.
- 799 – Pending sales, 7.4% more than November 2024.
- 4.5 – Months of inventory, 1.0 month more than November 2024.
- $307,845,475 – Total dollar volume of homes sold, 20.1% less than November 2024.
- 91.7% – Average close to list price, compared to 93.3% in November 2024.
November 2025 - For Lease
- 551 – Closed leases, 18.6% less than November 2024.
- $2,000 – Median price for rent, 4.5% less than November 2024.
- 601 – New lease listings on the market, 5.1% less than November 2024.
- 1,671 – Active lease listings on the market, 10.4% more than November 2024.
- 560 – Pending leases, 14.0% less than November 2024.
- 3.0 – Months of inventory, 1.0 months more than November 2024.
- $1,166,559 – Total dollar volume of leases, 20.5% less than November 2024.
- 94.1% – Average close to list price, compared to 93.7% in November 2024.
Hays County
November 2025 - For Sale
- 266– Residential homes sold, 31.3% less than November 2024.
- $390,000 – Median price for residential homes, 6.9% more than November 2024.
- 386 – New home listings on the market, 18.4% less than November 2024.
- 1,640 – Active home listings on the market, 3.3% less than November 2024.
- 341 – Pending sales, 1.8% more than November 2024.
- 4.4 – Months of inventory, 0.1 months less than November 2024.
- $143,978,536 – Total dollar volume of homes sold, 18.0% less than November 2024.
- 91.0% – Average close to list price, compared to 91.9% in November 2024.
November 2025 - For Lease
- 147 – Closed leases, 16.9% less than November 2024.
- $1,950 – Median price for rent, 2.3% less than November 2024.
- 159 – New lease listings on the market, 27.1% less than November 2024.
- 468 – Active lease listings on the market, 7.5% less than November 2024.
- 158 – Pending leases, 0.6% more than November 2024.
- 3.0 – Months of inventory, flat compared to November 2024.
- $329,669 – Total dollar volume of leases, 11.0% less than November 2024.
- 93.6% – Average close to list price, compared to 93.8% in November 2024.
Bastrop County
November 2025 - For Sale
- 74 – Residential homes sold, 18.7% less than November 2024.
- $365,000 – Median price for residential homes, 0.8% less than November 2024.
- 143 – New home listings on the market, 8.9% less than November 2024.
- 742 – Active home listings on the market, 15.4% more than November 2024.
- 101 – Pending sales, 5.2% more than November 2024.
- 7.2 – Months of inventory, 1.3 months more than November 2024.
- $29,637,209 – Total dollar volume of homes sold, 22.5% less than November 2024.
- 91.0% – Average close to list price, compared to 92.0% in November 2024.
November 2025 - For Lease
- 33 – Closed leases, 21.4% less than November 2024.
- $1,995 – Median price for rent, 5.0% more than November 2024.
- 48 – New lease listings on the market, 50.0% more than November 2024.
- 107 – Active lease listings on the market, 30.5% more than November 2024.
- 32 – Pending leases, 27.3% less than November 2024.
- 3.0 – Months of inventory, 1.0 months more than November 2024.
- $67,983 – Total dollar volume of leases, 19.8% less than November 2024.
- 95.4% – Average close to list price, compared to 93.9% in November 2024.
Caldwell County
November 2025 - For Sale
- 27 – Residential homes sold, 15.6% less than November 2024.
- $265,000– Median price for residential homes, 10.2% less than November 2024.
- 32 – New home listings on the market, 15.8% less than November 2024.
- 195 – Active home listings on the market, 40.3% more than November 2024.
- 32 – Pending sales, 33.3% more than November 2024.
- 6.1 – Months of inventory, 2.8 months more than November 2024.
- $8,430,037 – Total dollar volume of homes sold, 15.5% less than November 2024.
- 89.8% – Average close to list price, compared to 94.1% in November 2024.
November 2025 - For Lease
- 11 – Closed leases, 37.5% more than November 2024.
- $1,700 – Median price for rent, 8.1% less than November 2024.
- 17 – New lease listings on the market, 21.4% more than November 2024.
- 49 – Active lease listings on the market, 63.3% more than November 2024.
- 14 – Pending leases, 250.0% less than November 2024.
- 4.0 – Months of inventory, flat compared to November 2024.
- $19,842 – Total dollar volume of leases, 27.7% more than November 2024.
- 97.4% – Average close to list price, compared to 100.0% in November 2024.
For more information or to download the November 2025 Central Texas Housing Market Report, visit UnlockMLS.com/Stats.
|


or another way