Categories
All About Texas, Homeowner Guide, Real Estate Market StatisticsPublished August 11, 2026
Central Texas Housing Market Maintains Positive Momentum in July 2026

Central Texas Housing Market Maintains Positive Momentum in July 2026
The Central Texas housing market continued to show encouraging signs of stability and growth in July 2026, with more buyers entering the market and home values remaining relatively consistent.
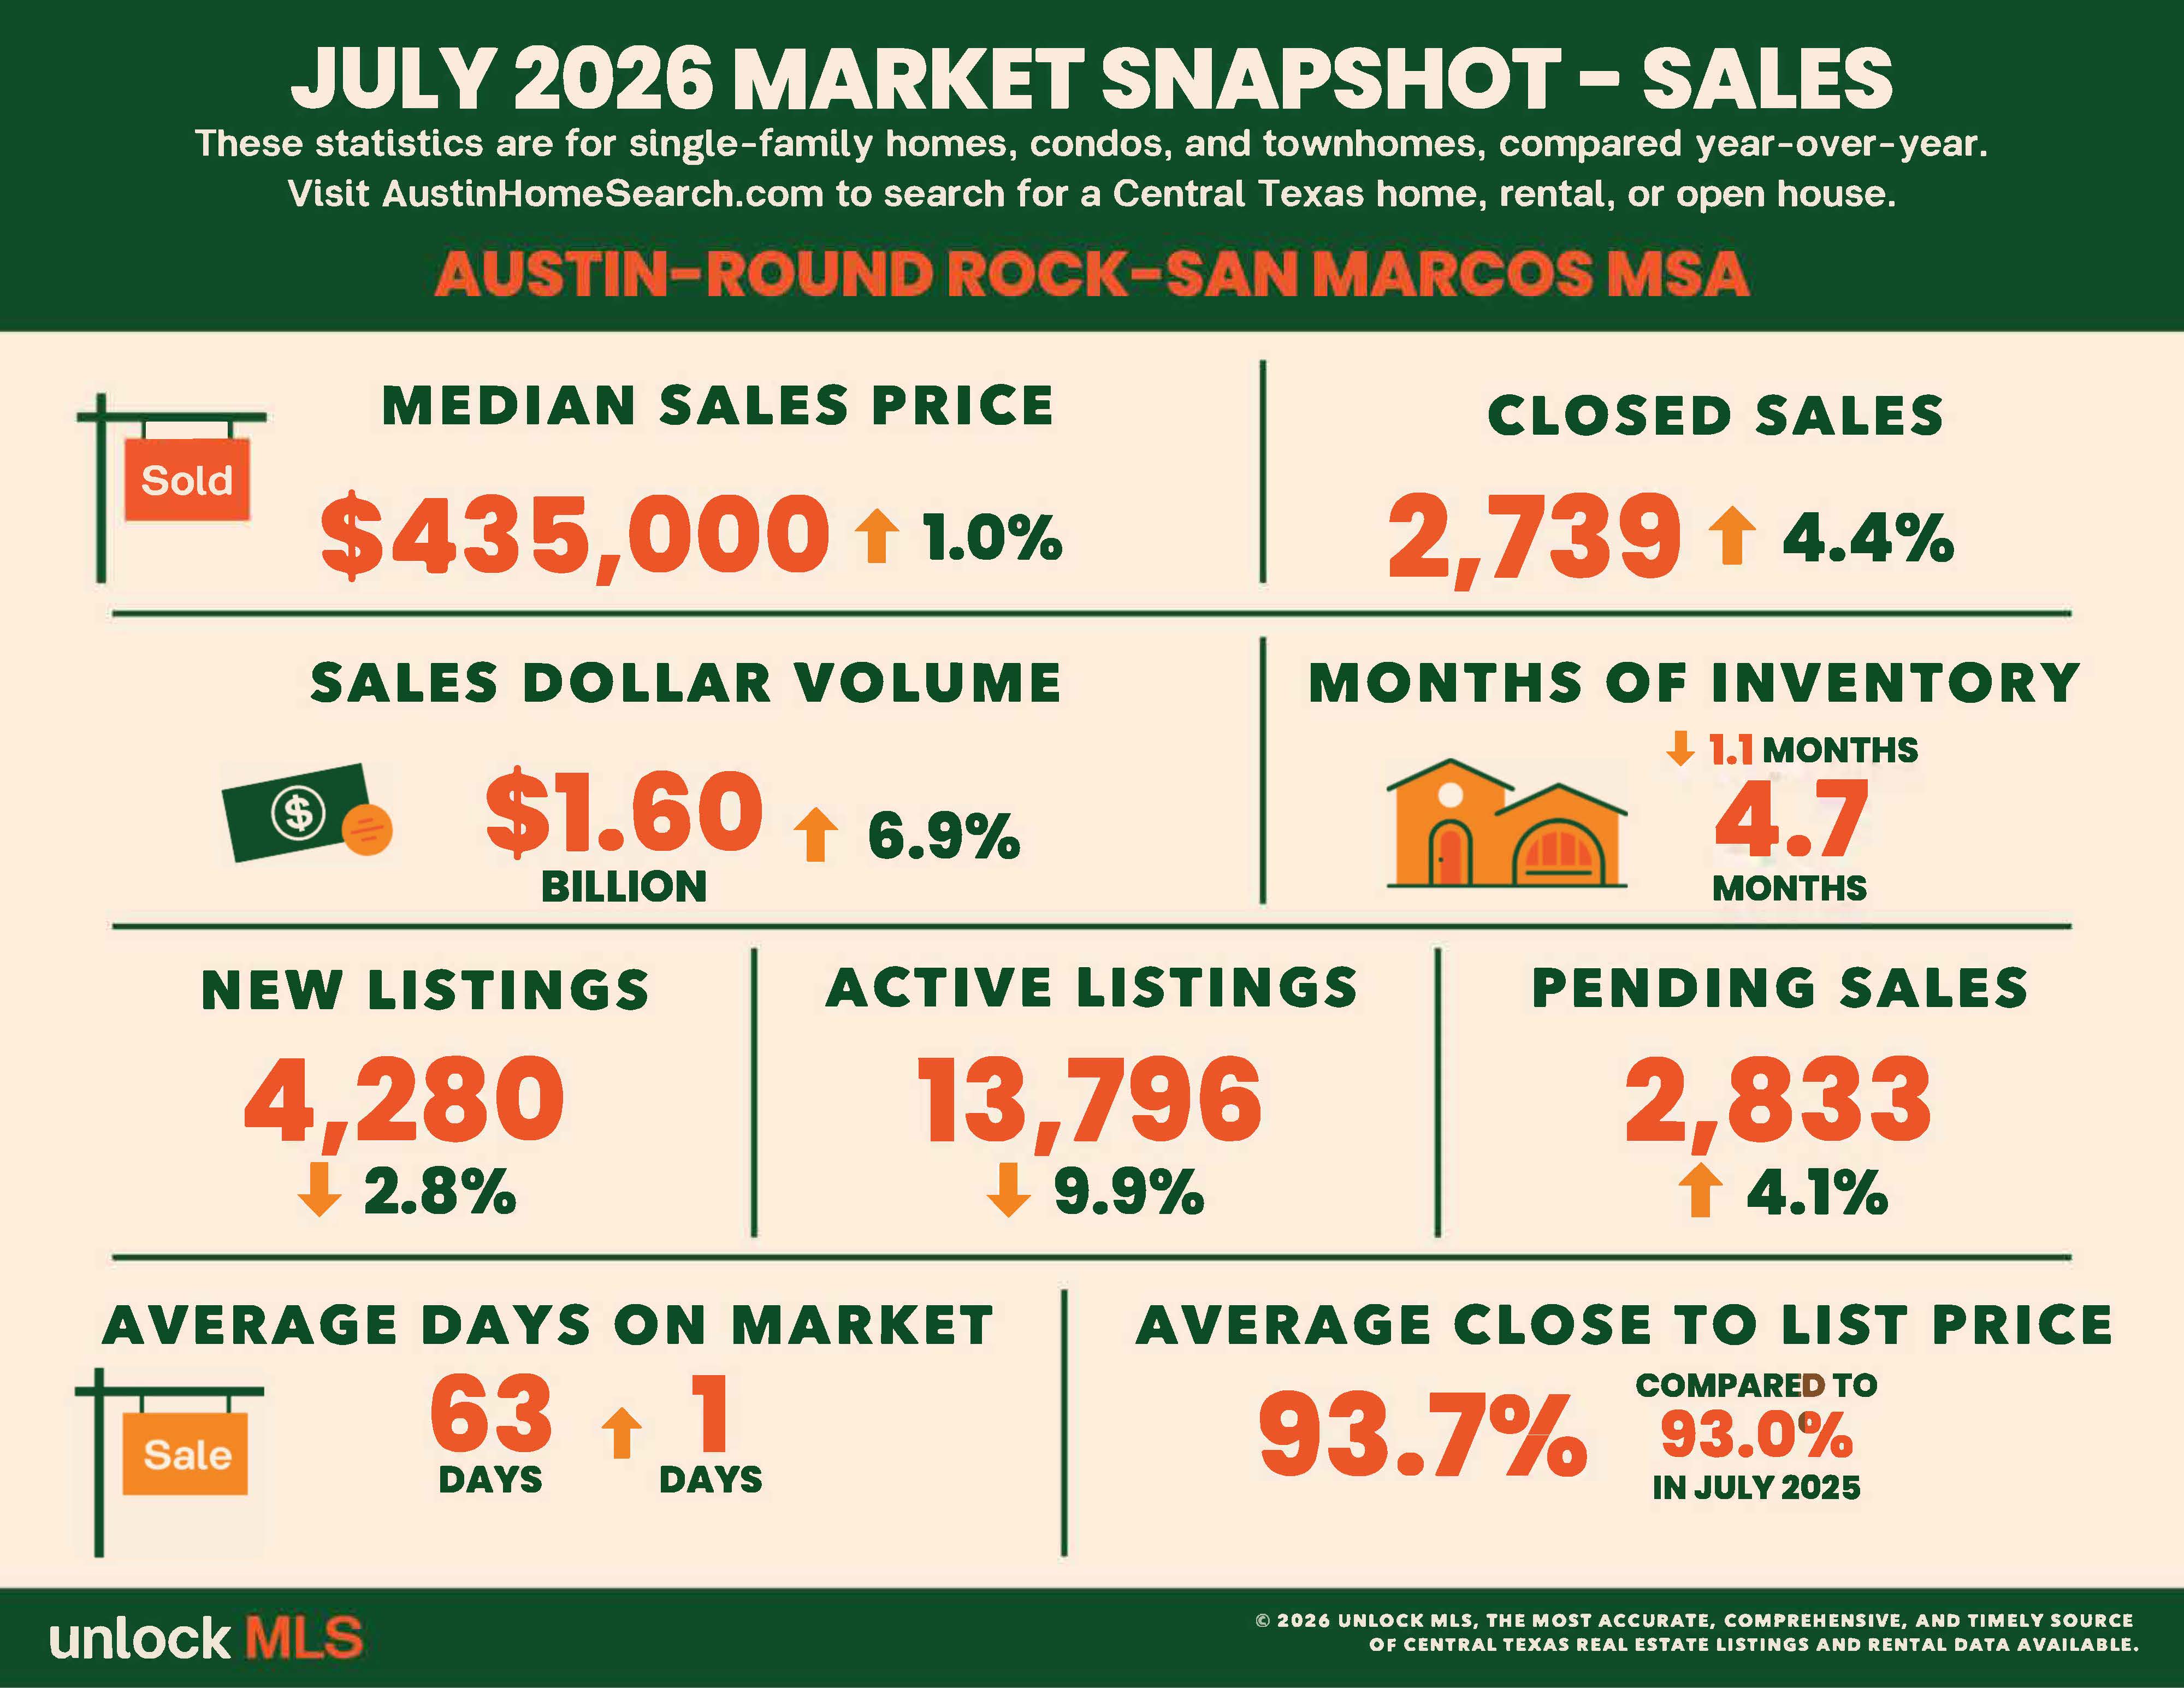
Recent housing data for the Austin-Round Rock-San Marcos metropolitan area recorded 2,739 residential home sales during the month, reflecting a 4.4% increase compared to July of last year. At the same time, the median home price edged up to $435,000, a modest 1% annual gain. Total residential sales topped $1.6 billion, highlighting continued activity across the region.
While mortgage interest rates remain higher than many buyers would prefer, market experts believe Central Texas continues to benefit from its strong economy. Ongoing corporate investments and job creation are attracting new residents, helping sustain housing demand and supporting the area's long-term real estate outlook.
Industry leaders also emphasize that affordability remains one of the region's biggest challenges. Although negotiating a home's purchase price is important, the overall cost of homeownership extends well beyond the closing table. Expenses such as property taxes, utility bills, insurance, and maintenance continue to influence whether families can comfortably afford to stay in their homes.
Housing research indicates that even relatively small increases in recurring monthly housing costs can place additional financial pressure on thousands of Central Texas households. As cities and counties prepare future budgets and evaluate taxes and public service fees, many housing professionals encourage local officials to consider how these decisions affect long-term affordability.
For buyers, today's market offers more opportunities than in recent years, with balanced pricing and steady inventory creating room for negotiation. Sellers continue to benefit from consistent demand fueled by the region's expanding population and economic growth.
Looking ahead, housing experts, community leaders, and policymakers will gather at the annual Central Texas Housing Summit this September to discuss market trends, affordability, and strategies that can help ensure sustainable housing opportunities for current and future residents.
As Central Texas continues to grow, maintaining a balance between economic expansion and housing affordability will remain essential for preserving a healthy and accessible real estate market.
Austin-Round Rock-San Marcos MSA
July 2026 - For Sale
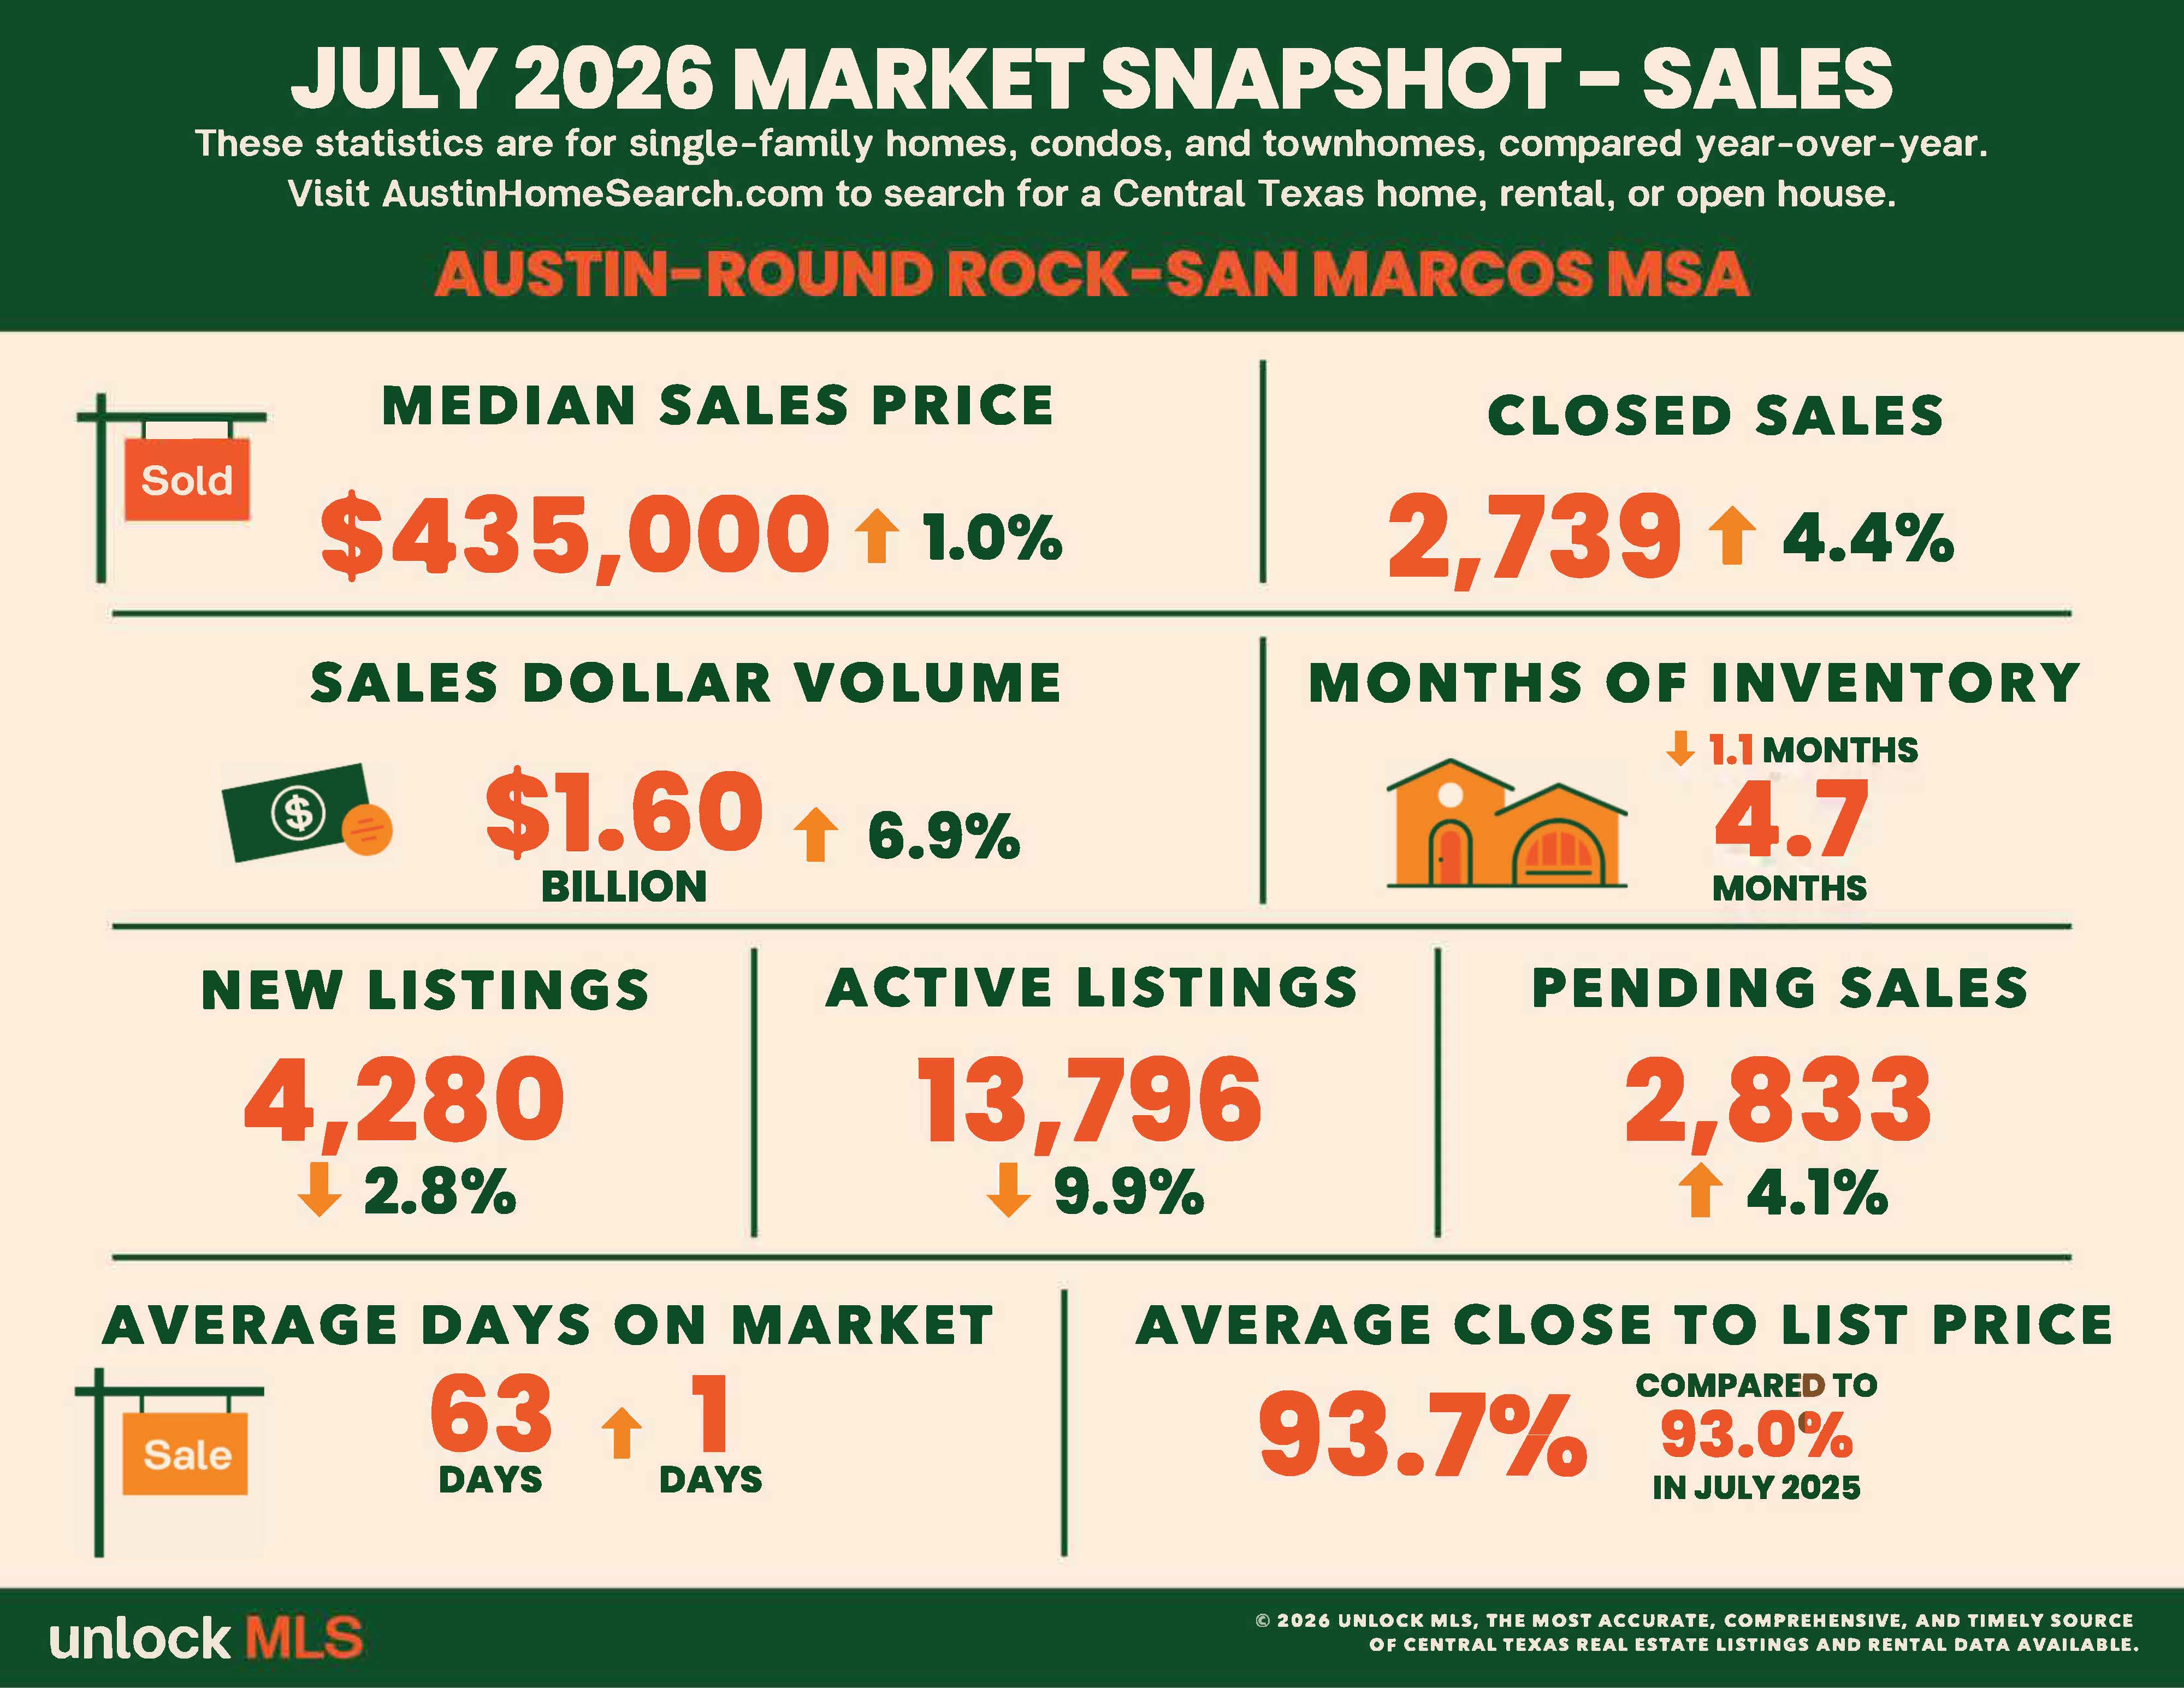
- 2,739 – Residential homes sold, 4.4% more than July 2025.
- $435,000 – Median price for residential homes, 1.0% more than July 2025.
- 4,280 – New home listings on the market, 2.8% less than July 2025.
- 13,796 – Active home listings on the market, 9.9% less than July 2025.
- 2,833 – Pending sales, 4.1% more than July 2025.
- 4.7 – Months of inventory, 1.1 less than July 2025.
- $1,603,859,017 – Total dollar volume of homes sold, 6.9% more than July 2025.
- 93.7% – Average close to list price, compared to 93.0% in July 2025.
July 2026 - For Lease
- 3,230 – Closed leases, 6.5% less than July 2025.
- $2,195 – Median price for rent, 0.2% less than July 2025.
- 4,021 – New lease listings on the market, 7.8% less than July 2025.
- 4,342 – Active lease listings on the market, 26.2% less than July 2025.
- 3,476 – Pending sales, 3.5% more than July 2025.
- 1.7 – Months of inventory, 0.3 months less than July 2025.
- $7,735,652 – Total dollar volume of leases, 7.8% less than July 2025.
- 97.4% – Average close to list price, compared to 96.6% in July 2025.
City of Austin
July 2026 - For Sale
- 1,005 – Residential homes sold, 11.0% more than July 2025.
- $577,000 – Median price for residential homes, 1.4% less than July 2025.
- 1,444 – New home listings on the market, 8.5% less than July 2025.
- 4,718 – Active home listings on the market, 18.2% less than July 2025.
- 999 – Pending sales, 4.2% more than July 2025.
- 4.5 – Months of inventory, 1.8 less than July 2025.
- $762,759,192 – Total dollar volume of homes sold, 11.5% more than July 2025.
- 93.9% – Average close to list price, compared to 92.8% in July 2025.
July 2026 - For Lease
- 1,729 – Closed leases, 7.2% less than July 2025.
- $2,200 – Median price for rent, 4.3% less than July 2025.
- 2,009 – New lease listings on the market, 11.4% less than July 2025.
- 2,133– Active lease listings on the market, 23.9% less than July 2025.
- 1,853 – Pending sales, 1.6% more than July 2025.
- 1.7 – Months of inventory, 0.2 months less than July 2025.
- $4,309,483 – Total dollar volume of leases, 11.0% less than July 2025.
- 96.7% – Average close to list price, compared to 96.3% in July 2025.
Travis County
July 2026 - For Sale
- 1,290 – Residential homes sold, 11.4% more than July 2025.
- $520,000 – Median price for residential homes, 0.3% less than July 2025.
- 1,972 – New home listings on the market, 3.3% less than July 2025.
- 6,586 – Active home listings on the market, 13.0% less than July 2025.
- 1,323 – Pending sales, 8.3% more than July 2025.
- 4.8 – Months of inventory, 1.7 months less than July 2025.
- $909,515,300 – Total dollar volume of homes sold, 11.1% more than July 2025.
- 93.7% – Average close to list price, compared to 92.8% in July 2025.
July 2026 - For Lease
- 1,940 – Closed leases, 6.0% more than July 2025.
- $2,200 – Median price for rent, 2.2% less than July 2025.
- 2,309 – New lease listings on the market, 9.2% less than July 2025.
- 2,611 – Active lease listings on the market, 20.3% less than July 2025.
- 2,107 – Pending sales, 4.0% more than July 2025.
- 1.9 – Months of inventory, 0.1 months less than July 2025.
- $4,834,094 – Total dollar volume of leases, 8.7% less than July 2025.
- 96.7% – Average close to list price, compared to 96.3% in July 2025.
Williamson County
July 2026 - For Sale
- 957 – Residential homes sold, 6.0% more than July 2025.
- $415,000 – Median price for residential homes, 1.2% less than July 2025.
- 1,534 – New home listings on the market, 2.7% more than July 2025.
- 4,258 – Active home listings on the market, 10.1% less than July 2025.
- 927 – Pending sales, 3.3% more than July 2025.
- 4.3 – Months of inventory, 0.9 months less than July 2025.
- $461,708,126 – Total dollar volume of homes sold, 7.0% more than July 2025.
- 93.9% – Average close to list price, compared to 93.3% in July 2025.
July 2026 - For Lease
- 938 – Closed leases, 8.6% less than July 2025.
- $2,200 – Median price for rent, 0.2% more than July 2025.
- 1,228 – New lease listings on the market, 8.2% less than July 2025.
- 1,190 – Active lease listings on the market, 38.4% less than July 2025.
- 998 – Pending sales, 0.7% more than July 2025.
- 1.4 – Months of inventory, 0.6 months less than July 2025.
- $2,134,639 – Total dollar volume of leases, 7.5% less than July 2025.
- 98.5% – Average close to list price, compared to 97.1% in July 2025.
Hays County
July 2026 - For Sale
- 344 – Residential homes sold, 12.0% less than July 2025.
- $367,700 – Median price for residential homes, 1.0% more than July 2025.
- 511 – New home listings on the market, 12.8% less than July 2025.
- 1,925 – Active home listings on the market, 5.4% less than July 2025.
- 409 – Pending sales, 7.9% less than July 2025.
- 5 – Months of inventory, 0.2 months less than July 2025.
- $175,021,308 – Total dollar volume of homes sold, 6.5% less than July 2025.
- 93.4% – Average close to list price, compared to 92.7% to July 2025.
July 2026 - For Lease
- 275 – Closed leases, 0.7% less than July 2025.
- $2,000 – Median price for rent, 4.8% less than July 2025.
- 368 – New lease listings on the market, 4.8% more than July 2025.
- 405 – Active lease listings on the market, 21.8% less than July 2025.
- 291 – Pending sales, 16.4% more than July 2025.
- 2.0 – Months of inventory, 2.0 months more than July 2025.
- $611,093 – Total dollar volume of leases, 2.3% less than July 2025.
- 97.8% – Average close to list price, compared to 97.4% in July 2025.
Bastrop County
July 2026 - For Sale
- 110 – Residential homes sold, 16.0% less than July 2025.
- $346,140 – Median price for residential homes, 2.3% more than July 2025.
- 204 – New home listings on the market, 3.3% less than July 2025.
- 758 – Active home listings on the market, 6.2% less than July 2025.
- 128 – Pending sales, 16.4% more than July 2025.
- 6.3 – Months of inventory, 0.3 months less than July 2025.
- $44,677,852 – Total dollar volume of homes sold, 7.0% less than July 2025.
- 92.7% – Average close to list price, compared to 93.5% in July 2025.
July 2026 - For Lease
- 59 – Closed leases, 4.8% less than July 2025.
- $1,950 – Median price for rent, 2.6% more than July 2025.
- 88 – New lease listings on the market, 8.3% less than July 2025.
- 106 – Active lease listings on the market, 10.9% less than July 2025.
- 61 – Pending sales, 4.7% less than July 2025.
- 2.4 – Months of inventory, 0.1 months less than July 2025.
- $125,878 – Total dollar volume of leases, 3.0% more than July 2025.
- 97.8% – Average close to list price, compared to 96.7% in July 2025.
Caldwell County
July 2026 - For Sale
- 38 – Residential homes sold, 7.3% less than July 2025.
- $254,000 – Median price for residential homes, 16.4% less than July 2025.
- 59 – New home listings on the market, 10.6% less than July 2025.
- 269 – Active home listings on the market, 59.2% more than July 2025.
- 46 – Pending sales, 6.1% less than July 2025.
- 7.7 – Months of inventory, 3.5 months more than July 2025.
- $12,936,431– Total dollar volume of homes sold, 5.9% less than July 2025.
- 91.5% – Average close to list price, compared to 92.6% in July 2025.
July 2026 - For Lease
- 18 – Closed leases, 30.8% less than July 2025.
- $1,774 – Median price for rent, 25.6% more than July 2025.
- 28 – New lease listings on the market, 17.6% less than July 2025.
- 30 – Active lease listings on the market, 25.0% less than July 2025.
- 19 – Pending sales, 34.5% less than July 2025.
- 1.0 – Months of inventory, 1.0 months more than July 2025.
- $29,948 – Total dollar volume of leases, 21.9% less than July 2025.
- 98.6% – Average close to list price, compared to 98.1% in July 2025.
Source: UnlockMLS

Dyron Taylor
Broker I Owner GRI, ABR, SFR | Taylor Realty Group | Keller Williams Realty Austin
or another way