
Categories
All About Texas, Real Estate Market StatisticsPublished March 11, 2026
Austin Housing Market Shows Signs of Strength as Spring Season Approaches

Austin Housing Market Shows Signs of Strength as Spring Season Approaches
AUSTIN, Texas — The housing market in the Austin-Round Rock-San Marcos metropolitan area is gaining traction as the spring homebuying season approaches. Data from the Unlock MLS February 2026 Central Texas Housing Report shows an increase in buyer activity and improving alignment between buyers and sellers.
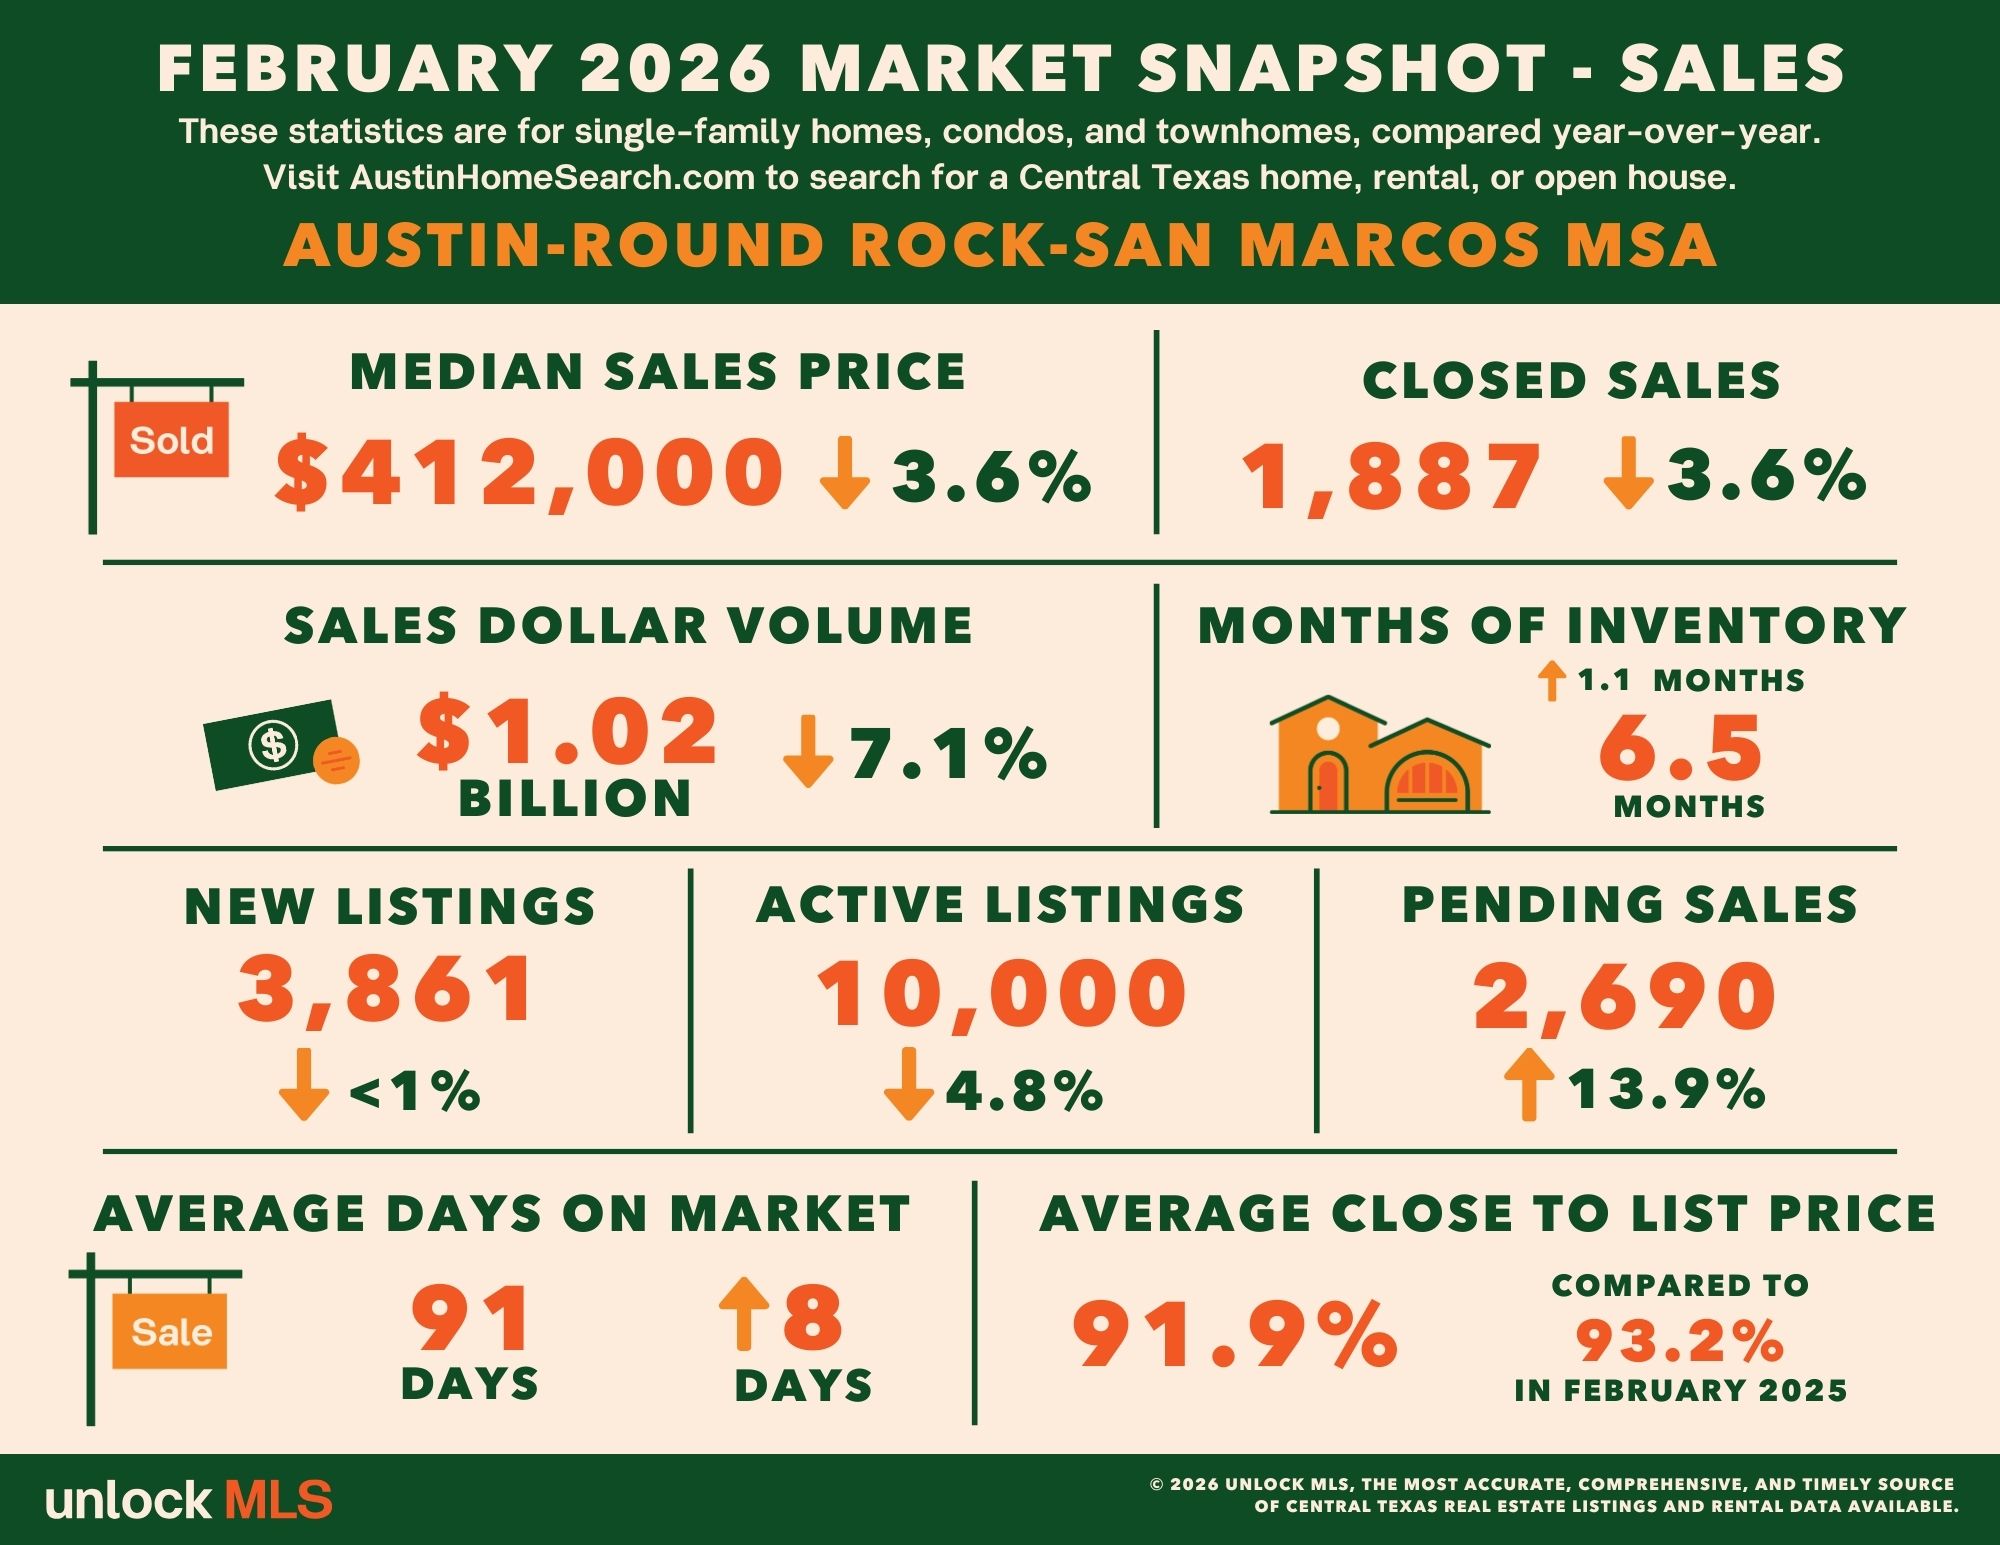
Pending home sales across the metro area climbed to 2,690 transactions in February, representing a 13.9% increase compared to the same time last year. Market competitiveness also improved, with the close-to-list price ratio rising to 92.0% in February, up from 90.6% in December, suggesting that negotiations between buyers and sellers are becoming more balanced.
According to Vaike O’Grady, market research advisor for Unlock MLS, the latest numbers indicate a shift from the slower market patterns seen in recent years.
Over the past two years, the region averaged roughly 12,076 active listings, but February’s inventory dropped to around 10,000 homes, marking a 4.8% decrease compared to a year ago. O’Grady explained that while the number of sellers entering the market remains relatively steady, buyer demand is increasing at a faster pace.
This trend is helping create a more balanced housing market, giving buyers an opportunity to re-engage after a period of hesitation. The renewed activity suggests the market may be building momentum heading into the traditionally busy spring season.
Meanwhile, John Crowe, president of Unlock MLS and the Austin Board of Realtors for 2026, said the latest data is providing greater clarity for both buyers and sellers.
For much of the past year, many prospective buyers delayed their decisions while monitoring whether home prices would continue to decline. Now, Crowe says current market conditions appear to be encouraging more buyers to move forward with their plans.
He also emphasized the value of working with experienced real estate professionals who rely on accurate market data. By using the resources available through Unlock MLS, agents can provide clients with real-time insights, allowing them to make informed decisions based on current market trends rather than speculation or headlines.
Austin-Round Rock-San Marcos MSA
February 2026 - For Sale
- 1,887 – Residential homes sold, 3.6% less than February 2025.
- $412,000 – Median price for residential homes, 3.6% less than February 2025.
- 3,861 – New home listings on the market, 0.8% less than February 2025.
- 10,000 – Active home listings on the market, 4.8% less than February 2025.
- 2,690 – Pending sales, 13.9% more than February 2025.
- 6.5 – Months of inventory, 1.1 more than February 2025.
- $1,022,593,378 – Total dollar volume of homes sold, 7.1% less than February 2025.
- 91.9% – Average close to list price, compared to 93.2% in February 2025.
February 2026 - For Lease
- 2,304 – Closed leases, 4.2% more than February 2025.
- $2,000 – Median price for rent, 4.8% less than February 2025.
- 2,913 – New lease listings on the market, 18.1% more than February 2025.
- 6,447 – Active lease listings on the market, 59.6% more than February 2025.
- 2,639 – Pending sales, 16.9% more than February 2025.
- 2.8 – Months of inventory, 0.7 months more than February 2025.
- $5,224,059 – Total dollar volume of leases, 0.4% less than February 2025.
- 96.2% – Average close to list price, flat compared to February 2025.
City of Austin
February 2026 - For Sale
- 664 – Residential homes sold, 4.7% less than February 2025.
- $540,000 – Median price for residential homes, 2.7% less than February 2025.
- 1,399 – New home listings on the market, 3.8% less than February 2025.
- 3,148 – Active home listings on the market, 13.0% less than February 2025.
- 923 – Pending sales, 15.1% more than February 2025.
- 6.2 – Months of inventory, 1.0 more than February 2025.
- $476,868,162 – Total dollar volume of homes sold, 7.8% less than February 2025.
- 92.1% – Average close to list price, compared to 92.9% in February 2025.
February 2026 - For Lease
- 1,184 – Closed leases, 11.2% more than February 2025.
- $2,100 – Median price for rent, 5.6% less than February 2025.
- 1,556 – New lease listings on the market, 25.7% more than February 2025.
- 4,163 – Active lease listings on the market, 105.4% more than February 2025.
- 1,343 – Pending sales, 26.3% more than February 2025.
- 3.0 – Months of inventory, 0.6 months more than February 2025.
- $2,878,921 – Total dollar volume of leases, 3.5% more than February 2025.
- 96.1% – Average close to list price, compared to 95.8% in February 2025.
Travis County
February 2026 - For Sale
- 843 – Residential homes sold, 4.5% less than February 2025.
- $489,900 – Median price for residential homes, 2.0% less than February 2025.
- 1,930 – New home listings on the market, 2.4% more than February 2025.
- 4,513 – Active home listings on the market, 8.6% less than February 2025.
- 1,234 – Pending sales, 14.4% more than February 2025.
- 6.6 – Months of inventory, 1.0 months more than February 2025.
- $564,564,716 – Total dollar volume of homes sold, 8.3% less than February 2025.
- 91.9% – Average close to list price, compared to 93.1% in February 2025.
February 2026 - For Lease
- 1,336 – Closed leases, 11.0% more than February 2025.
- $2,096 – Median price for rent, 4.7% less than February 2025.
- 1,780 – New lease listings on the market, 26.6% more than February 2025.
- 4,163 – Active lease listings on the market, 74.0% more than February 2025.
- 1,505 – Pending sales, 23.7% more than February 2025.
- 3.0 – Months of inventory, 0.6 months more than February 2025.
- $3,232,081 – Total dollar volume of leases, 4.5% more than February 2025.
- 96.1% – Average close to list price, compared to 96.0% in February 2025.
Williamson County
February 2026 - For Sale
- 663 – Residential homes sold, 1.8% less than February 2025.
- $395,850 – Median price for residential homes, 5.4% less than February 2025.
- 1,141 – New home listings on the market, 5.5% less than February 2025.
- 3,109 – Active home listings on the market, 1.6% less than February 2025.
- 903 – Pending sales, 17.1% more than February 2025.
- 5.8 – Months of inventory, 1.1 months more than February 2025.
- $300,184,245 – Total dollar volume of homes sold, 5.7% less than February 2025.
- 92.7% – Average close to list price, compared to 93.8% in February 2025.
February 2026 - For Lease
- 709 – Closed leases, 3.4% less than February 2025.
- $2,000 – Median price for rent, 4.8% less than February 2025.
- 780 – New lease listings on the market, 2.1% more than February 2025.
- 1,582 – Active lease listings on the market, 37.2% more than February 2025.
- 853 – Pending sales, 13,0% more than February 2025.
- 2.3 – Months of inventory, 0.6 months more than February 2025.
- $1,464,845 – Total dollar volume of leases, 7.7% less than February 2025.
- 96.6% – Average close to list price, compared to 96.4% in February 2025.
Hays County
February 2026 - For Sale
- 267 – Residential homes sold, 3.3% less than February 2025.
- $355,000 – Median price for residential homes, 1.4% less than February 2025.
- 536 – New home listings on the market, 6.3% less than February 2025.
- 1,502 – Active home listings on the market, 9.2% less than February 2025.
- 375 – Pending sales, 5.0% more than February 2025.
- 6.4 – Months of inventory, 0.4 months more than February 2025.
- $119,458,023 – Total dollar volume of homes sold, 1.7% less than February 2025.
- 91.7% – Average close to list price, compared to 92.6% February 2025.
February 2026 - For Lease
- 197 – Closed leases, 4.4% less than February 2025.
- $1,950 – Median price for rent, 2.3% less than February 2025.
- 252 – New lease listings on the market, 16.1% more than February 2025.
- 489 – Active lease listings on the market, 23.2% more than February 2025.
- 221 – Pending sales, 0.9% more than February 2025.
- 2.8 – Months of inventory, flat compared to February 2025.
- $418,906 – Total dollar volume of leases, 5.0% less than February 2025.
- 96.0% – Average close to list price, compared to 96.6% in February 2025.
Bastrop County
February 2026 - For Sale
- 83 – Residential homes sold, 11.7% less than February 2025.
- $335,000 – Median price for residential homes, 4.9% less than February 2025.
- 194 – New home listings on the market, 11.5% more than February 2025.
- 688 – Active home listings on the market, 15.2% more than February 2025.
- 128 – Pending sales, 4.9% more than February 2025.
- 10.1 – Months of inventory, 3.2 months more than February 2025.
- $30,794,664 – Total dollar volume of homes sold, 13.3% less than February 2025.
- 89.7% – Average close to list price, compared to 93.0% in February 2025.
February 2026 - For Lease
- 40 – Closed leases, 4.8% less than February 2025.
- $1,850 – Median price for rent, 2.4% less than February 2025.
- 67 – New lease listings on the market, 34.0% more than February 2025.
- 133 – Active lease listings on the market, 98.5% more than February 2025.
- 40 – Pending sales, flat compared to February 2025.
- 2.6 – Months of inventory, 0.6 months more than February 2025.
- $70,969– Total dollar volume of leases, 10.5% less than February 2025.
- 95.9% – Average close to list price, compared to 95.3% in February 2025.
Caldwell County
February 2026 - For Sale
- 31 – Residential homes sold, 6.9% more than February 2025.
- $221,990 – Median price for residential homes, 23.5% less than February 2025.
- 60 – New home listings on the market, 9.1% more than February 2025.
- 188 – Active home listings on the market, 19.7% more than February 2025.
- 50 – Pending sales, 51.5% more than February 2025.
- 5.9 – Months of inventory, 3.5 months more than February 2025.
- $7,591,730– Total dollar volume of homes sold, 16.2% less than February 2025.
- 82.9% – Average close to list price, compared to 91.8% in February 2025.
February 2026 - For Lease
- 22 – Closed leases, 15.4% less than February 2025.
- $1,725 – Median price for rent, 4.2% less than February 2025.
- 34 – New lease listings on the market, 17.2% more than February 2025.
- 80 – Active lease listings on the market, 166.7% more than February 2025.
- 20 – Pending sales, 23.1% less than February 2025.
- 4.7 – Months of inventory, flat compared to February 2025.
- $37,258– Total dollar volume of leases, 18.8% less than February 2025.
- 96.8% – Average close to list price, compared to 95.4% in February 2025.
For more information or to download the February 2026 Central Texas Housing Market Report, visit UnlockMLS.com/Stats.
|


or another way