Categories
All About Texas, Real Estate Market StatisticsPublished May 12, 2026
Central Texas Housing Market Finds Its Rhythm in Spring 2026

Central Texas Housing Market Finds Its Rhythm in Spring 2026
The Central Texas housing market is entering a new chapter this spring — one defined less by bidding wars and frantic competition, and more by balance, strategy, and opportunity.
According to recent housing data released by Unlock MLS, buyer activity across the Austin-Round Rock-San Marcos region is gaining momentum again after a slower start to the year. Pending home sales climbed sharply during the first quarter of 2026, signaling renewed confidence from buyers who had previously been sidelined by affordability concerns and fluctuating mortgage rates.
At the same time, the market is becoming more approachable for many households. Median home prices across the metro area have moderated compared to the peaks seen during the pandemic housing boom, while inventory levels have continued to rise. This combination is creating a healthier environment where buyers have more choices and sellers must compete more strategically.
A Shift Away From the Frenzy
For several years, Central Texas real estate operated in an extreme seller’s market. Homes sold within days, buyers routinely waived contingencies, and prices accelerated at historic rates.
That pace has slowed considerably.
Today’s market is moving toward more traditional conditions. Homes are staying on the market longer, negotiations are becoming more common, and pricing accuracy matters more than ever. Industry professionals say this isn’t a collapse — it’s a normalization after years of unsustainable growth.
This transition is especially noticeable in the Austin metro area, where rising inventory is giving buyers more leverage than they’ve had in years. Sellers who price aggressively without considering current market conditions are often seeing longer days on market and more price reductions before attracting serious offers. Meanwhile, well-prepared homes that are competitively priced are still moving successfully.
Buyers Are Returning With More Confidence
One of the clearest signs of renewed activity is the jump in pending sales throughout the region. Market analysts point to growing buyer confidence despite continued economic uncertainty and mortgage rates that remain elevated compared to pre-2022 levels.
For many buyers, the current environment offers advantages that simply did not exist during the height of the market frenzy:
- More homes available to choose from
- Less pressure to make rushed decisions
- Increased negotiating power
- Greater potential for seller concessions
First-time homebuyers may benefit the most from these changing conditions. As prices stabilize and competition eases, entering the market has become more realistic for buyers who were previously priced out.
Sellers Must Adapt to a More Strategic Market
While buyers are gaining flexibility, sellers can still succeed — but strategy now plays a much larger role.
Real estate professionals across Central Texas emphasize that presentation, pricing, and preparation are critical in today’s environment. Homes that are updated, staged well, and priced appropriately are still attracting strong interest, particularly in desirable neighborhoods and price ranges.
However, sellers who rely on outdated expectations from the ultra-competitive pandemic market may face challenges. Buyers are comparing more options, negotiating more carefully, and expecting value before making offers.
In many ways, the market now rewards realism over urgency.
Inventory Growth Is Creating Balance
Another important trend shaping the region is the continued rise in housing inventory. Active listings have increased across much of Central Texas, helping shift the market toward more balanced conditions between buyers and sellers.
Housing experts often view a balanced market as one where neither side holds overwhelming control. Current inventory levels in the Austin metro suggest the region is approaching that equilibrium after years of imbalance.
This matters because balanced markets tend to produce:
- More sustainable price growth
- Healthier long-term housing conditions
- Less volatility for homeowners
- More predictable transactions
For communities across Central Texas, that stability could help support continued growth while easing some of the affordability pressures that intensified during recent years.
Looking Ahead
As the spring and summer selling seasons continue, much will depend on mortgage rate stability, economic conditions, and whether buyer demand continues accelerating through the second quarter.
Even so, the overall direction of the market appears increasingly clear: Central Texas real estate is evolving into a more measured and sustainable environment.
The days of extreme competition may be fading, but activity is far from disappearing. Buyers are re-entering the market, sellers are adjusting expectations, and the region’s long-term appeal — fueled by job growth, population migration, and economic development — remains strong.
For both buyers and sellers, success in 2026 will likely depend less on timing the market perfectly and more on understanding how this new, more balanced market truly works.
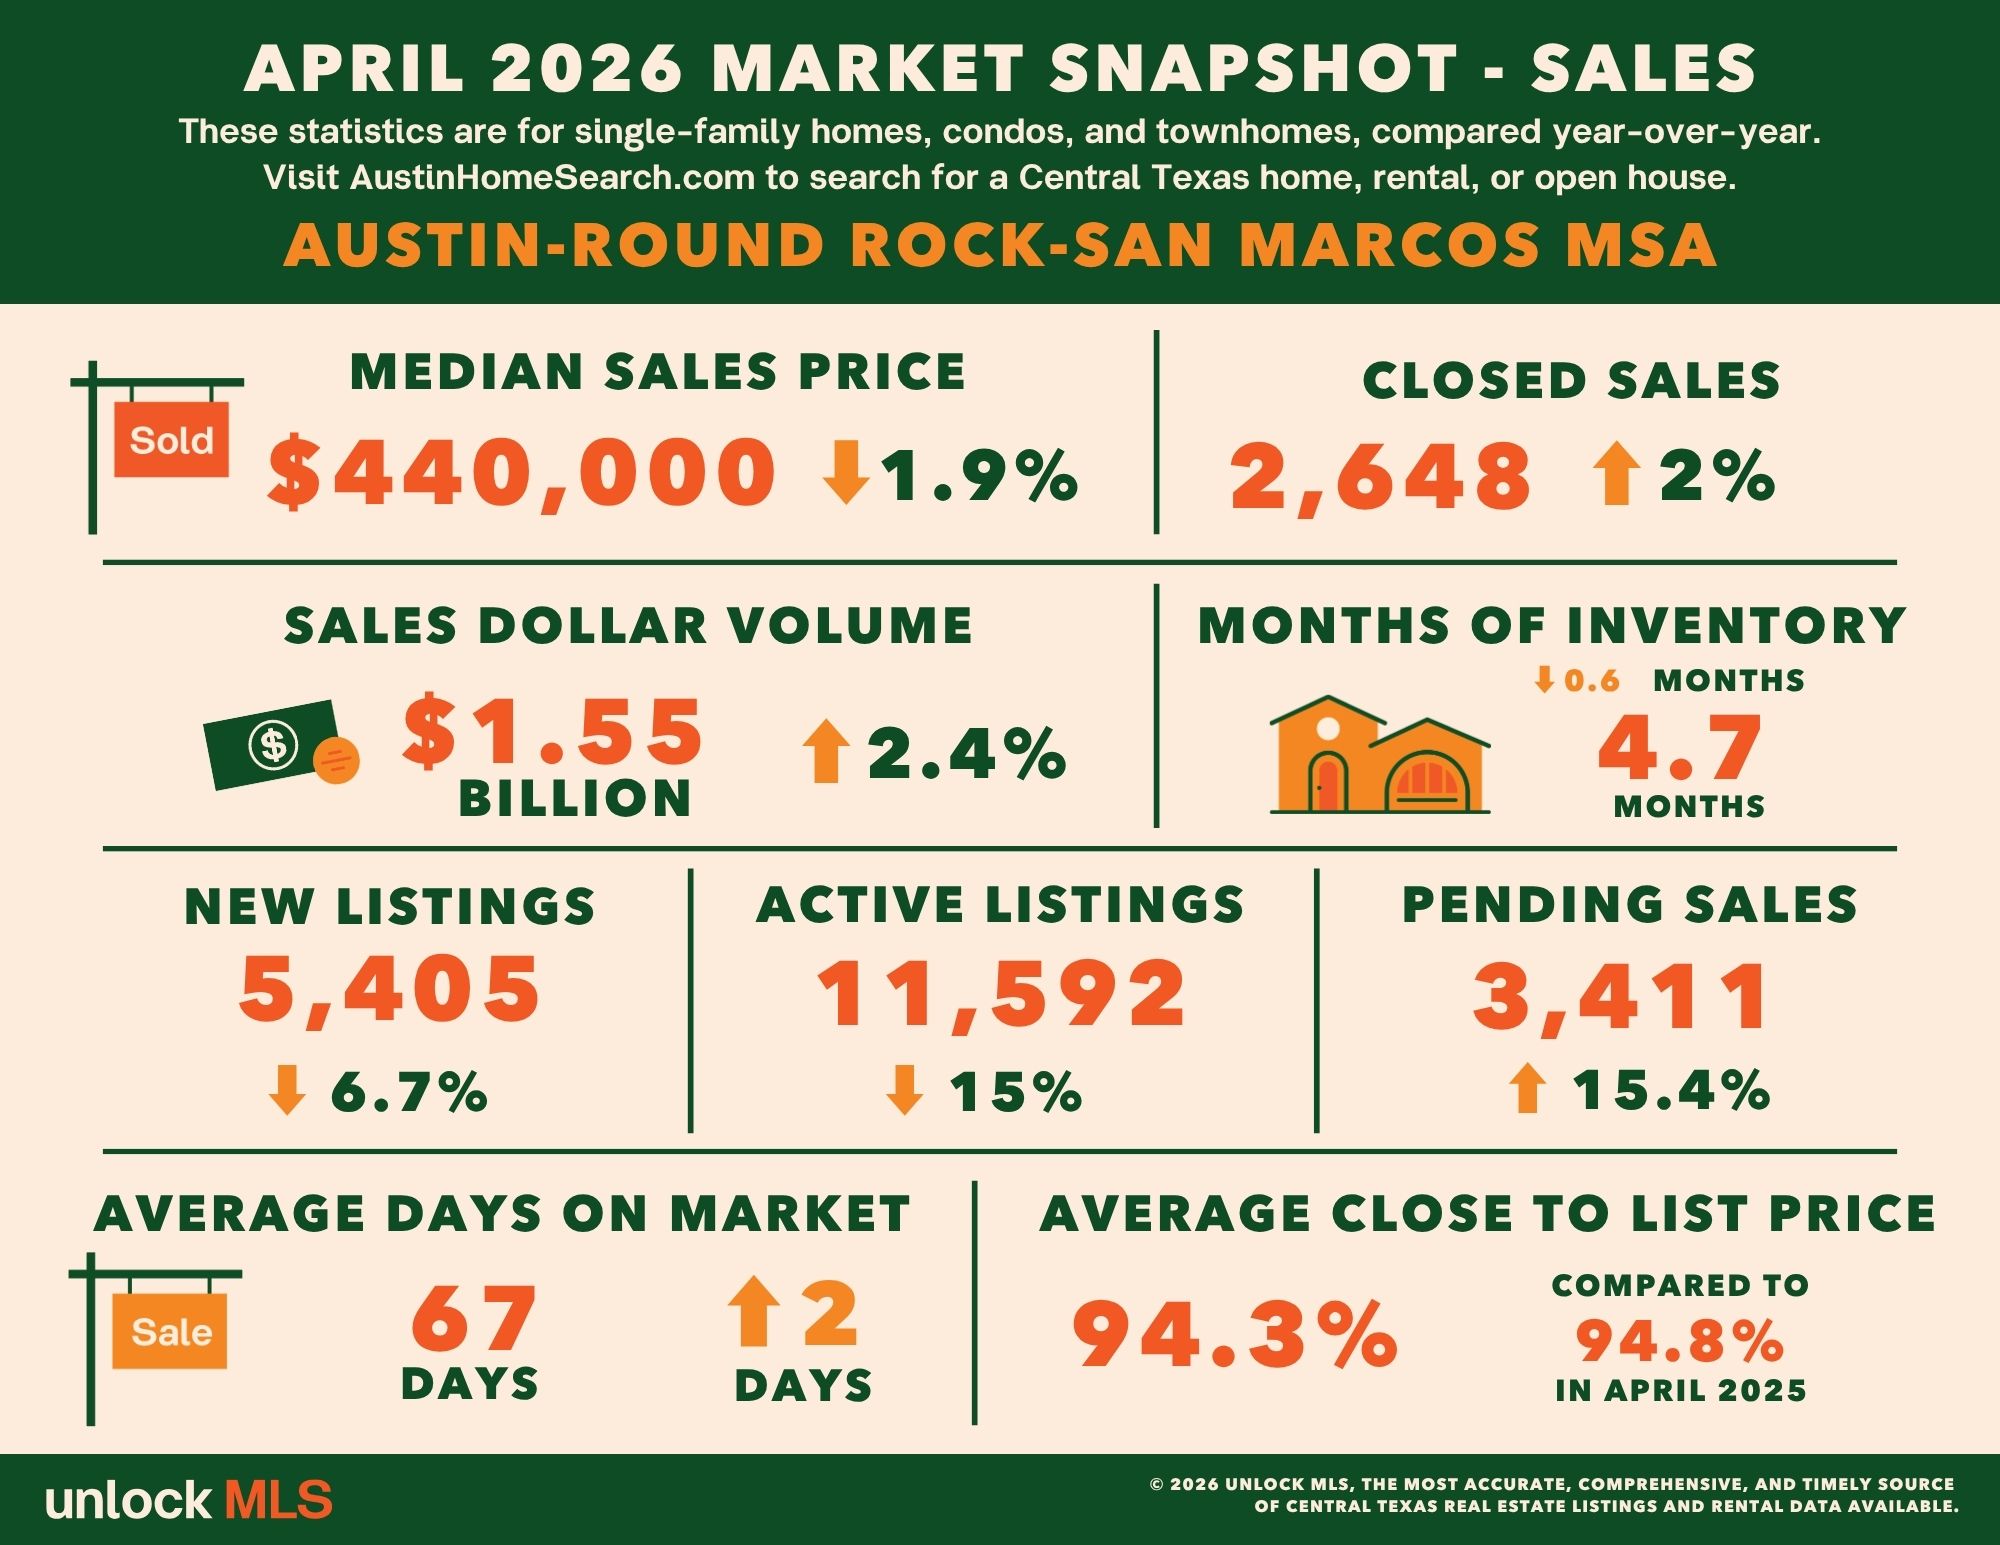
Austin-Round Rock-San Marcos MSA
April 2026 - For Sale
- 2,648 – Residential homes sold, 2.0% more than April 2025.
- $440,000 – Median price for residential homes, 1.9% less than April 2025.
- 5,405 – New home listings on the market, 6.7% less than April 2025.
- 11,592 – Active home listings on the market, 15.0% less than April 2025.
- 3,411 – Pending sales, 15.4% more than April 2025.
- 4.7 – Months of inventory, 0.6 less than April 2025.
- $1,554,376,535 – Total dollar volume of homes sold, 2.4% more than April 2025.
- 94.3% – Average close to list price, compared to 94.8% in April 2025.
April 2026 - For Lease
- 2,631 – Closed leases, 0.2% more than April 2025.
- $2,100 – Median price for rent, 4.5% less than April 2025.
- 3,623 – New lease listings on the market, 1.1% less than April 2025.
- 3,810 – Active lease listings on the market, 7.3% less than April 2025.
- 3,185 – Pending sales, 12.9% more than April 2025.
- 1.8 – Months of inventory, flat compared to April 2025.
- $6,214,492 – Total dollar volume of leases, 4.5% less than April 2025.
- 97.7% – Average close to list price, compared to 97.6% in April 2025.
City of Austin
April 2026 - For Sale
- 980 – Residential homes sold, 8.5% more than April 2025.
- $573,750 – Median price for residential homes, 3.2% less than April 2025.
- 2,032 – New home listings on the market, 11.7% less than April 2025.
- 3,987 – Active home listings on the market, 24.3% less than April 2025.
- 1,219 – Pending sales, 20.0% more than April 2025.
- 4.5 – Months of inventory, 1.4 less than April 2025.
- $748,006,685 – Total dollar volume of homes sold, 6.1% more than April 2025.
- 94.9% – Average close to list price, compared to 95.1% in April 2025.
April 2026 - For Lease
- 1,349 – Closed leases, 1.6% more than April 2025.
- $2,150 – Median price for rent, 6.5% less than April 2025.
- 1,862 – New lease listings on the market, 1.6 less than April 2025.
- 1,975– Active lease listings on the market, 6.4% less than April 2025.
- 1,631 – Pending sales, 13.0% more than April 2025.
- 2.0 – Months of inventory, flat compared to April 2025.
- $3,421,351 – Total dollar volume of leases, 4.3% less than April 2025.
- 97.5% – Average close to list price, compared to 97.4% in April 2025.
Travis County
April 2026 - For Sale
- 1,249 – Residential homes sold, 4.7% more than April 2025.
- $505,000 – Median price for residential homes, 1.9% less than April 2025.
- 2,644 – New home listings on the market, 10.3% less than April 2025.
- 5,615 – Active home listings on the market, 19.0% less than April 2025.
- 1,566 – Pending sales, 20.4% more than April 2025.
- 4.8 – Months of inventory, 1.0 months less than April 2025.
- $881,801,119 – Total dollar volume of homes sold, 4.8% more than April 2025.
- 94.6% – Average close to list price, compared to 95.0% in April 2025.
April 2026 - For Lease
- 1,540 – Closed leases, 1.5% more than April 2025.
- $2,159 – Median price for rent, 6.1% less than April 2025.
- 2,131 – New lease listings on the market, 0.7% less than April 2025.
- 2,369 – Active lease listings on the market, 5.3% less than April 2025.
- 1,850 – Pending sales, 14.7% more than April 2025.
- 2.1 – Months of inventory, 0.1 months more than April 2025.
- $3,901,556 – Total dollar volume of leases, 4.0% less than April 2025.
- 97.5% – Average close to list price, compared to 97.4% in April 2025.
Williamson County
April 2026 - For Sale
- 878 – Residential homes sold, 1.3% less than April 2025.
- $412,490 – Median price for residential homes, 4.1% less than April 2025.
- 1,728 – New home listings on the market, 0.9% less than April 2025.
- 3,460 – Active home listings on the market, 12.8% less than April 2025.
- 1,183 – Pending sales, 18.7% more than April 2025.
- 4.1 – Months of inventory, 0.4 months less than April 2025.
- $423,180,384 – Total dollar volume of homes sold, 2.5% less than April 2025.
- 94.7% – Average close to list price, compared to 95.0% in April 2025.
April 2026 - For Lease
- 811 – Closed leases, 2.1% less than April 2025.
- $2,095 – Median price for rent, 2.6% less than April 2025.
- 1,101 – New lease listings on the market, 1.4% less than April 2025.
- 941 – Active lease listings on the market, 19.4% less than April 2025.
- 962 – Pending sales, 7.2% more than April 2025.
- 1.3 – Months of inventory, 0.2 months less than April 2025.
- $1,737,776 – Total dollar volume of leases, 5.9% less than April 2025.
- 98.0% – Average close to list price, compared to 97.8% in April 2025.
Hays County
April 2026 - For Sale
- 350 – Residential homes sold, 3.0% less than April 2025.
- $419,990 – Median price for residential homes, 8.8% more than April 2025.
- 699 – New home listings on the market, 10.0% less than April 2025.
- 1,601 – Active home listings on the market, 14.4% less than April 2025.
- 437 – Pending sales, 14.3% less than April 2025.
- 4.7 – Months of inventory, 0.6 months less than April 2025.
- $183,236,211 – Total dollar volume of homes sold, 0.8% less than April 2025.
- 94.1% – Average close to list price, flat compared to April 2025.
April 2026 - For Lease
- 217 – Closed leases, flat compared to April 2025.
- $1,971 – Median price for rent, 2.4% less than April 2025.
- 300 – New lease listings on the market, 2.3% less than April 2025.
- 351 – Active lease listings on the market, 3.8% more than April 2025.
- 281 – Pending sales, 16.6% more than April 2025.
- 2.0 – Months of inventory, 0.5 months more than April 2025.
- $455,114 – Total dollar volume of leases, 3.6% less than April 2025.
- 97.5% – Average close to list price, compared to 98.3% in April 2025.
Bastrop County
April 2026 - For Sale
- 123 – Residential homes sold, 9.8% more than April 2025.
- $350,000 – Median price for residential homes, 2.9% more than April 2025.
- 227 – New home listings on the market, 7.3% less than April 2025.
- 712 – Active home listings on the market, 2.0% more than April 2025.
- 163 – Pending sales, 45.5% more than April 2025.
- 7.3 – Months of inventory, 0.1 months more than April 2025.
- $50,227,818 – Total dollar volume of homes sold, 9.5% more than April 2025.
- 91.1% – Average close to list price, compared to 93.0% in April 2025.
April 2026 - For Lease
- 41 – Closed leases, 14.6% less than April 2025.
- $1,950 – Median price for rent, 0.3% less than April 2025.
- 66 – New lease listings on the market, 9.6% less than April 2025.
- 108 – Active lease listings on the market, 42.1% more than April 2025.
- 63 – Pending sales, 21.2% more than April 2025.
- 3.5 – Months of inventory, 1.4 months more than April 2025.
- $83,079 – Total dollar volume of leases, 11.4% less than April 2025.
- 98.3% – Average close to list price, compared to 96.8% in April 2025.
Caldwell County
April 2026 - For Sale
- 48 – Residential homes sold, 23.1% more than April 2025.
- $262,994 – Median price for residential homes, 12.3% less than April 2025.
- 107 – New home listings on the market, 28.9% more than April 2025.
- 204 – Active home listings on the market, 12.1% more than April 2025.
- 62 – Pending sales, 72.2% more than April 2025.
- 6.0 – Months of inventory, 0.5 months more than April 2025.
- $15,931,003– Total dollar volume of homes sold, 30.3% more than April 2025.
- 90.2% – Average close to list price, compared to 95.1% in April 2025.
April 2026 - For Lease
- 22 – Closed leases, 37.5% more than April 2025.
- $1,695 – Median price for rent, 5.2% less than April 2025.
- 25 – New lease listings on the market, 13.6% more than April 2025.
- 41 – Active lease listings on the market, 46.4% more than April 2025.
- 29 – Pending sales, 61.1% more than April 2025.
- 2.1 – Months of inventory, 0.4 months more than April 2025.
- $36,967 – Total dollar volume of leases, 38.9% more than April 2025.
- 95% – Average close to list price, compared to 96.8% in April 2025.
For more information or to download the April 2026 Central Texas Housing Market Report, visit UnlockMLS.com/Stats.

Dyron Taylor
Broker I Owner GRI, ABR, SFR | Taylor Realty Group | Keller Williams Realty Austin
or another way