Categories
All About Texas, Real Estate Market StatisticsPublished April 14, 2026
Central Texas Housing Market Gains Momentum Heading Into Spring

Central Texas Housing Market Gains Momentum Heading Into Spring
AUSTIN, Texas — The Austin-Round Rock-San Marcos metro area is entering the spring season with renewed energy, according to the latest March and Q1 2026 housing report from Unlock MLS. Market activity picked up toward the end of the quarter, with March data highlighting a noticeable increase in buyer interest.
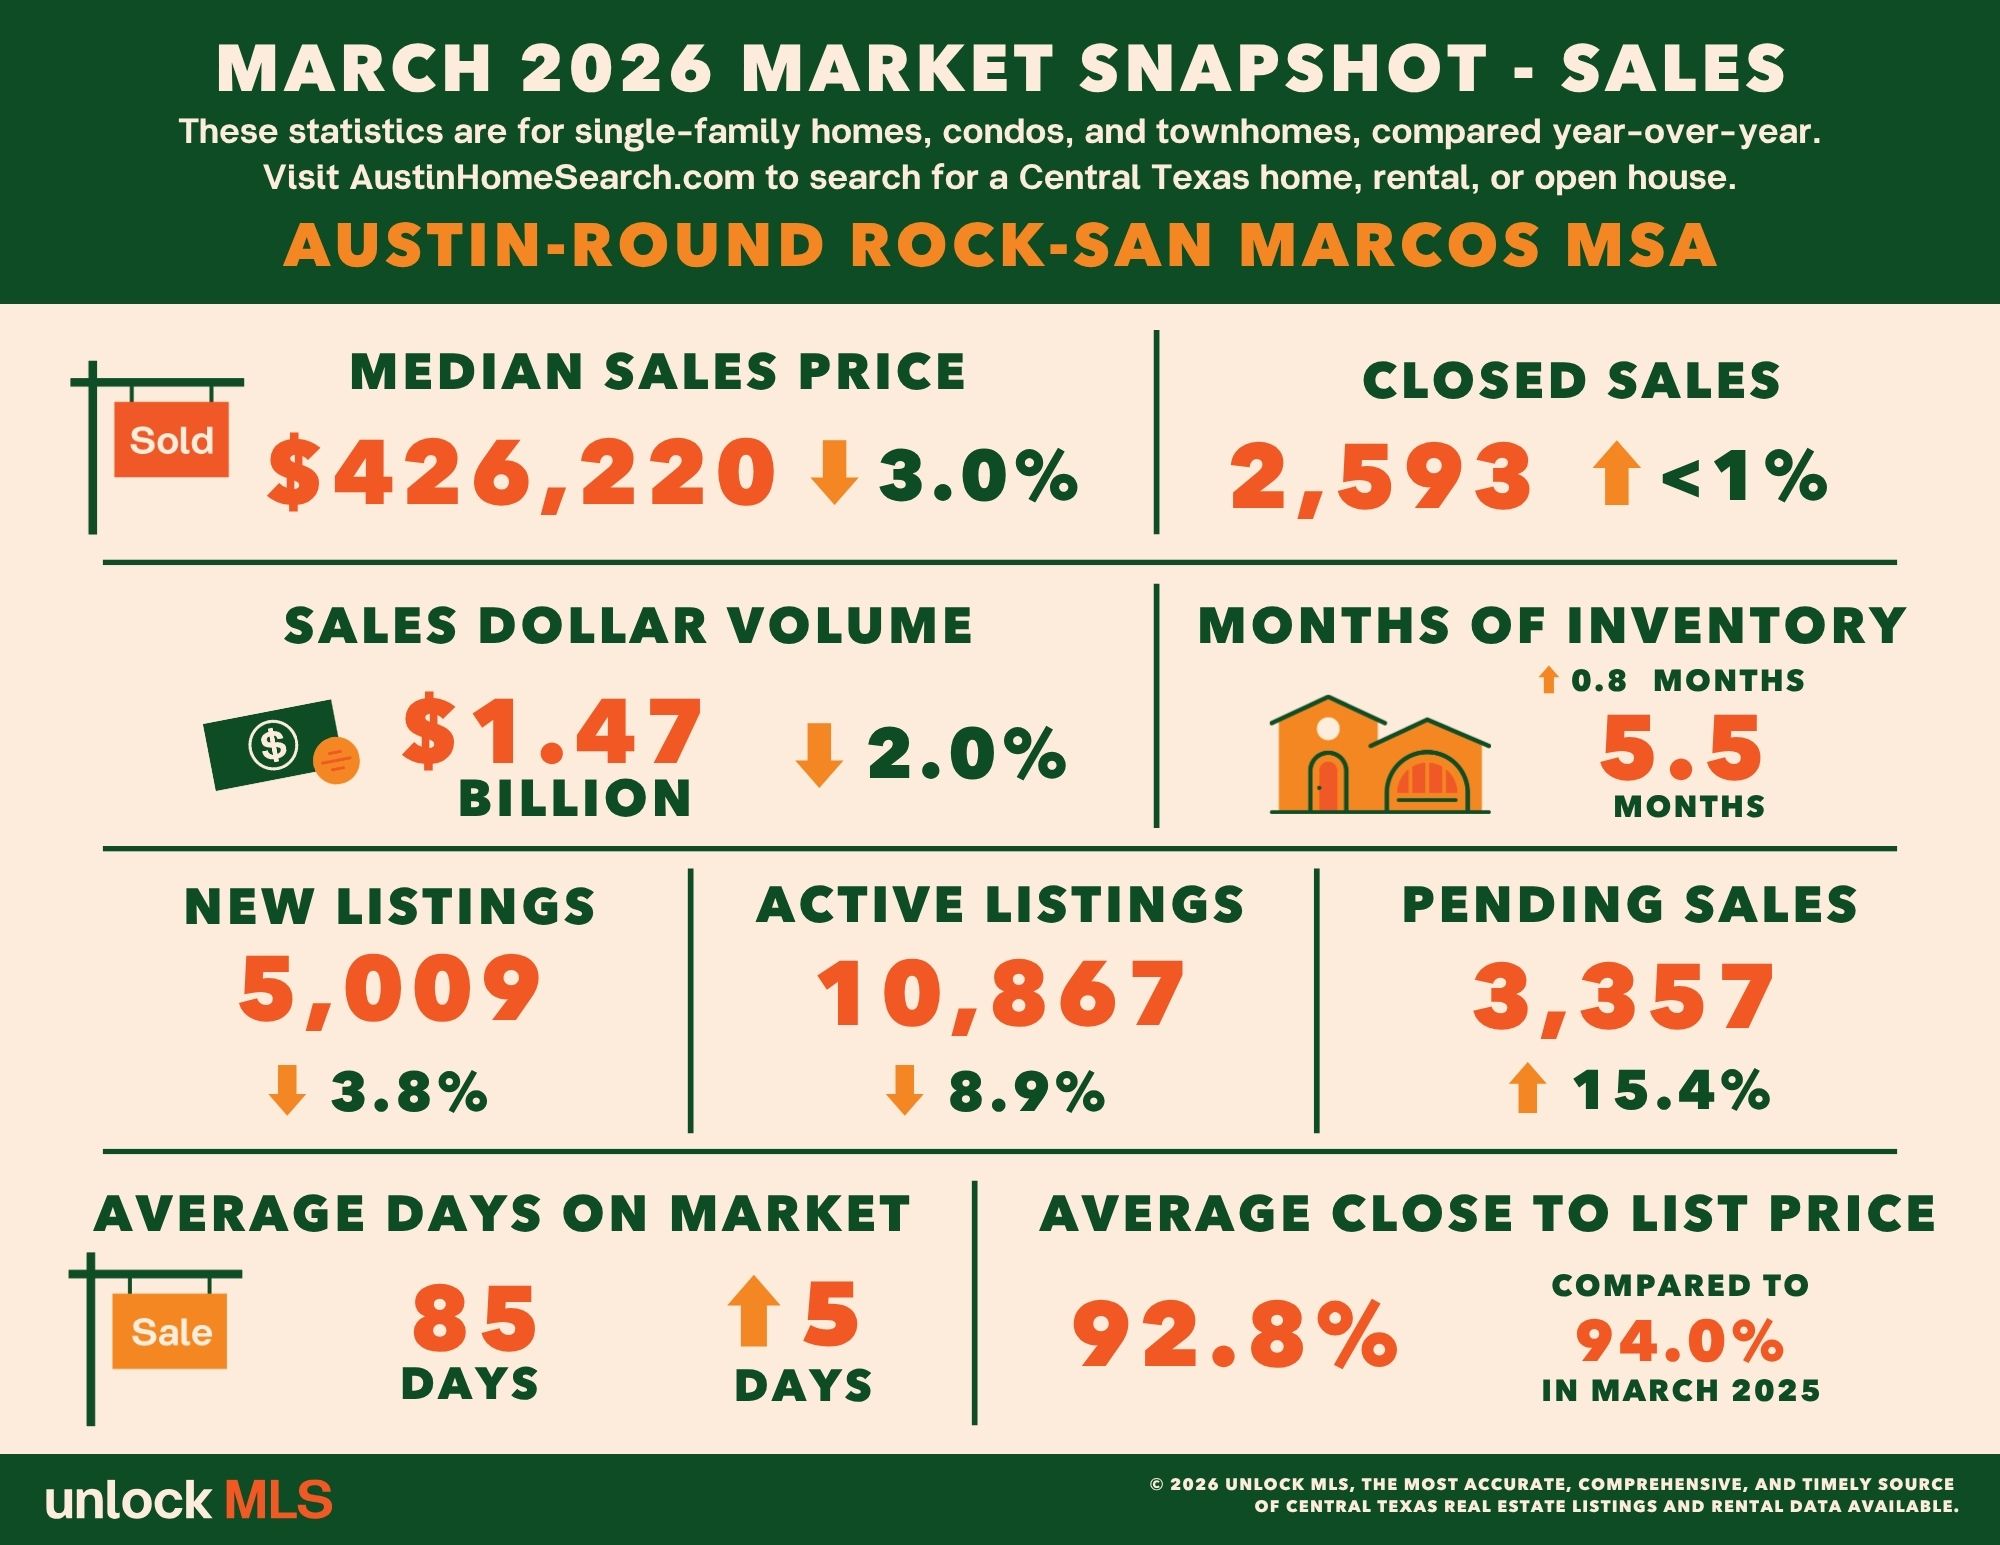
In March, the median home price settled at $426,220, marking the lowest March level since 2021. This price adjustment is helping improve affordability after several years of rapid increases. Home sales reached 2,593 closings, a slight 0.5% increase year over year, while pending sales rose significantly by 15.4% to 3,357, pointing to stronger demand moving forward.
Looking at the first quarter overall, the market showed signs of rebalancing. The median home price declined 3.4% to $415,300, while the number of active listings grew 4.5% to 33,751 homes. Inventory levels rose to 5.5 months, giving buyers more options and signaling a shift toward more balanced market conditions. As supply increases and pricing adjusts, buyers are gaining more flexibility while sellers adapt to a steadier pace of activity.
Vaike O’Grady, a market research advisor at Unlock MLS, noted that March reflected a turning point not fully captured in the quarterly numbers.
“While quarterly data provides a broader view, it doesn’t fully reflect the shift we saw between February and March. Even with ongoing global uncertainty and elevated interest rates, the Central Texas market is beginning to normalize. The strong month-over-month growth in both pending and closed sales shows that buyers are still active and ready to move when pricing aligns with expectations. Additionally, improved affordability is creating opportunities for those who were previously priced out—particularly first-time buyers—allowing them to enter the market with more confidence.”
John Crowe, president of Unlock MLS and ABoR for 2026, emphasized the importance of working with knowledgeable professionals as the market evolves.
“As activity increases, success in this market comes down to preparation and strategy. Buyers and sellers who stay informed and partner with experienced Unlock MLS agents are in a stronger position to take advantage of opportunities. With shifting conditions, pricing and timing are critical, and having the right guidance can help ensure a smooth and successful transaction.”
Austin-Round Rock-San Marcos MSA
Q1 2026 - For Sale
- 6,186 – Residential homes sold, 1.8% less than Q1 2025.
- $415,300 – Median price for residential homes, 3.4% less than Q1 2025.
- 12,322 – New home listings on the market, 2.3% less than Q1 2025.
- 33,751 – Active home listings on the market, 4.5% more than Q1 2025.
- 8,110 – Pending sales, 10.9% more than Q1 2025.
- 5.5 – Months of inventory, 0.3 months more than Q1 2025.
- $3,410,000,000 – Total dollar volume of homes sold, 3.9% less than Q1 2025.
- 92.6% – Average close to list price, compared to 93.3% in Q1 2025.
March 2026 - For Sale
- 2,593 – Residential homes sold, 0.5% more than March 2025.
- $426,220 – Median price for residential homes, 3.0% less than March 2025.
- 5,009 – New home listings on the market, 3.8% less than March 2025.
- 10,867 – Active home listings on the market, 8.9% less than March 2025.
- 3,357 – Pending sales, 15.4% more than March 2025.
- 5.5 – Months of inventory, 0.8 more than March 2025.
- $1,472,720,680 – Total dollar volume of homes sold, 2.0% less than March 2025.
- 92.8% – Average close to list price, compared to 94.0% in March 2025.
March 2026 - For Lease
- 2,746 – Closed leases, 10.5% more than March 2025.
- $2,000 – Median price for rent, 7.0% less than March 2025.
- 3,240 – New lease listings on the market, 13.0% more than March 2025.
- 3,811 – Active lease listings on the market, 0.3% more than March 2025.
- 3,001 – Pending sales, 13.9% more than March 2025.
- 1.9 – Months of inventory, 0.1 months more than March 2025.
- $6,106,682 – Total dollar volume of leases, 2.7% more than March 2025.
- 96.4% – Average close to list price, compared to 96.7% in March 2025.
City of Austin
March 2026 - For Sale
- 900 – Residential homes sold, 2.9% more than March 2025.
- $550,000 – Median price for residential homes, 6.8% less than March 2025.
- 1,927 – New home listings on the market, 9.5% less than March 2025.
- 3,653 – Active home listings on the market, 17.8% less than March 2025.
- 1,077 – Pending sales, 10.5% more than March 2025.
- 5.4 – Months of inventory, 0.3 more than March 2025.
- $687,620,905 – Total dollar volume of homes sold, 1.5% more than March 2025.
- 93.8% – Average close to list price, flat compared to March 2025.
March 2026 - For Lease
- 1,490 – Closed leases, 24.4% more than March 2025.
- $2,025 – Median price for rent, 10.0% less than March 2025.
- 1,707 – New lease listings on the market, 18.8% more than March 2025.
- 1,982– Active lease listings on the market, 2.1% more than March 2025.
- 1,546 – Pending sales, 20.2% more than March 2025.
- 2.3 – Months of inventory, 0.2 months more than March 2025.
- $3,474,111 – Total dollar volume of leases, 10.9% more than March 2025.
- 96.0% – Average close to list price, compared to 96.5% in March 2025.
Travis County
March 2026 - For Sale
- 1,210 – Residential homes sold, 4.0% more than March 2025.
- $499,000 – Median price for residential homes, 4.0% less than March 2025.
- 2,549 – New home listings on the market, 4.5% less than March 2025.
- 5,162 – Active home listings on the market, 12.0% less than March 2025.
- 1,483 – Pending sales, 15.9% more than March 2025.
- 5.9 – Months of inventory, 0.8 months more than March 2025.
- $836,586,858 – Total dollar volume of homes sold, 0.3% more than March 2025.
- 93.4% – Average close to list price, compared to 93.9% in March 2025.
March 2026 - For Lease
- 1,649 – Closed leases, 21.1% more than March 2025.
- $2,000 – Median price for rent, 9.1% less than March 2025.
- 1,961 – New lease listings on the market, 19.2% more than March 2025.
- 2,354 – Active lease listings on the market, 2.3% more than March 2025.
- 1,767 – Pending sales, 21.9% more than March 2025.
- 2.3 – Months of inventory, 0.2 months more than March 2025.
- $3,814,605 – Total dollar volume of leases, 8.0% more than March 2025.
- 96.0% – Average close to list price, compared to 96.6% in March 2025.
Williamson County
March 2026 - For Sale
- 859 – Residential homes sold, 1.2% more than March 2025.
- $410,000 – Median price for residential homes, 1.9% less than March 2025.
- 1,531 – New home listings on the market, 1.8% less than March 2025.
- 3,244 – Active home listings on the market, 8.1% less than March 2025.
- 1,153 – Pending sales, 16.1% more than March 2025.
- 4.6 – Months of inventory, 0.4 months more than March 2025.
- $402,658,786 – Total dollar volume of homes sold, 0.3% less than March 2025.
- 92.7% – Average close to list price, compared to 94.7% in March 2025.
March 2026 - For Lease
- 800 – Closed leases, 2.1% less than March 2025.
- $2,000 – Median price for rent, 4.8% less than March 2025.
- 879 – New lease listings on the market, 2.5% less than March 2025.
- 976 – Active lease listings on the market, 9.1% less than March 2025.
- 940 – Pending sales, 8.2% more than March 2025.
- 1.4 – Months of inventory, 0.1 months less than March 2025.
- $1,696,205 – Total dollar volume of leases, 4.0% less than March 2025.
- 97.3% – Average close to list price, compared to 97.0% in March 2025.
Hays County
March 2026 - For Sale
- 368 – Residential homes sold, 6.1% less than March 2025.
- $381,250 – Median price for residential homes, 0.8% more than March 2025.
- 648 – New home listings on the market, 5.8% less than March 2025.
- 1,565 – Active home listings on the market, 10.1% less than March 2025.
- 511 – Pending sales, 12.6% more than March 2025.
- 5.3 – Months of inventory, 0.8 months more than March 2025.
- $176,806,333 – Total dollar volume of homes sold, 9.5% less than March 2025.
- 92.5% – Average close to list price, compared to 92.9% March 2025.
March 2026 - For Lease
- 221 – Closed leases, 8.7% less than March 2025.
- $1,995 – Median price for rent, 2.3% more than March 2025.
- 290 – New lease listings on the market, 32.4% more than March 2025.
- 336 – Active lease listings on the market, 4.0% more than March 2025.
- 223 – Pending sales, 10.4% less than March 2025.
- 1.7 – Months of inventory, flat compared to March 2025.
- $457,260 – Total dollar volume of leases, 11.4% less than March 2025.
- 96.9% – Average close to list price, compared to 95.9% in March 2025.
Bastrop County
March 2026 - For Sale
- 114 – Residential homes sold, 15.6% less than March 2025.
- $330,000 – Median price for residential homes, 8.3% less than March 2025.
- 212 – New home listings on the market, 8.6% less than March 2025.
- 708 – Active home listings on the market, 10.6% more than March 2025.
- 154 – Pending sales, 16.7% more than March 2025.
- 8.5 – Months of inventory, 3.4 months more than March 2025.
- $42,734,539 – Total dollar volume of homes sold, 23.3% less than March 2025.
- 90.1% – Average close to list price, compared to 93.5% in March 2025.
March 2026 - For Lease
- 46 – Closed leases, 7.0% more than March 2025.
- $2,000 – Median price for rent, flat compared to March 2025.
- 79 – New lease listings on the market, 11.3% more than March 2025.
- 100 – Active lease listings on the market, 38.9% more than March 2025.
- 45 – Pending sales, 2.2% less than March 2025.
- 3.1 – Months of inventory, 1.1 months more than March 2025.
- $90,248 – Total dollar volume of leases, 2.0% less than March 2025.
- 95.2% – Average close to list price, compared to 96.5% in March 2025.
Caldwell County
March 2026 - For Sale
- 42 – Residential homes sold, 5.0% more than March 2025.
- $277,500 – Median price for residential homes, 15.5% less than March 2025.
- 69 – New home listings on the market, 11.3% more than March 2025.
- 188 – Active home listings on the market, 23.7% more than March 2025.
- 56 – Pending sales, 9.8% more than March 2025.
- 6.3 – Months of inventory, 1.8 months more than March 2025.
- $13,934,164– Total dollar volume of homes sold, 3.0% more than March 2025.
- 89.1% – Average close to list price, compared to 92.7% in March 2025.
March 2026 - For Lease
- 30 – Closed leases, 36.4% more than March 2025.
- $1,625 – Median price for rent, 9.4% less than March 2025.
- 31 – New lease listings on the market, 3.3% more than March 2025.
- 45 – Active lease listings on the market, 60.7% more than March 2025.
- 26 – Pending sales, 23.8% more than March 2025.
- 2.8 – Months of inventory, 1.5 months more than March 2025.
- $48,364 – Total dollar volume of leases, 30.6% more than March 2025.
- 95.1% – Average close to list price, compared to 97.8% in March 2025.
SOURCE: UnlockMLS

Dyron Taylor
Broker I Owner GRI, ABR, SFR | Taylor Realty Group | Keller Williams Realty Austin
or another way