Categories
All About Texas, Real Estate Market StatisticsPublished July 14, 2026
Central Texas Housing Market Shows Strong Mid-Year Momentum in 2026

Central Texas Housing Market Shows Strong Mid-Year Momentum in 2026
The Central Texas housing market continues to gain traction as the second half of 2026 begins, offering encouraging news for both buyers and sellers. According to the latest June and Mid-Year 2026 Central Texas Housing Report from Unlock MLS, home sales remain on an upward trend, signaling a healthier and more balanced market despite ongoing economic uncertainty across the country.
After several years of fluctuating activity, the Austin-Round Rock-San Marcos metropolitan area appears to be moving toward its first annual increase in home sales in recent years. Growing buyer demand, steady inventory levels, and more moderate pricing are creating favorable conditions for those looking to enter or move within the market.
Home Sales Continue to Rise Across Central Texas
The first six months of 2026 have been particularly encouraging for the region. Year-to-date, approximately 15,700 homes have closed, representing nearly a 5% increase compared to the same period last year.
June also contributed to this positive trend, with closed sales posting a modest year-over-year increase, demonstrating that buyers remain active even as interest rates and broader economic conditions continue to evolve.
Perhaps even more significant is the rise in pending sales, which increased by more than 13% compared to last year. Since pending transactions often become future closings, this growth suggests that buyer activity is expected to remain strong throughout the coming months.
Pending Sales Reflect Continued Buyer Confidence
Pending sales are widely viewed as one of the most reliable indicators of future market performance. The continued increase in homes going under contract suggests that many buyers remain confident about purchasing despite higher financing costs than seen several years ago.
This sustained demand reflects several ongoing advantages in the Central Texas market, including:
- More inventory than during the pandemic-era housing boom
- Greater negotiating opportunities for buyers
- Improved selection across many price ranges
- Moderating home prices that have become more accessible for many households
These conditions have created a healthier environment where buyers have additional time to evaluate homes while sellers who price competitively continue attracting qualified offers.
Home Prices Are Becoming More Balanced
While home sales have increased, pricing has remained relatively stable.
The year-to-date median home price sits around $425,000, representing a slight decline from last year. Rather than indicating weakness, this moderation reflects a market that has become more balanced after several years of rapid appreciation.
For buyers, slower price growth can improve affordability and reduce the pressure to make rushed purchasing decisions. For sellers, success increasingly depends on realistic pricing, strong presentation, and effective marketing instead of relying solely on rapidly rising home values.
June Market Trends Show Additional Signs of Strength
Several key indicators from June point toward continued market improvement heading into the second half of the year.
Inventory tightened slightly during the month, homes spent fewer days on the market, and median prices showed year-over-year improvement. While one month does not establish a long-term trend, these factors suggest that market conditions may continue strengthening if buyer demand remains steady.
Together, these indicators paint a picture of a housing market that is gradually stabilizing rather than experiencing dramatic swings.
What This Means for Buyers
Today's Central Texas market offers several advantages for homebuyers:
- More homes are available than during previous years.
- Competition has become more manageable in many neighborhoods.
- Price growth has slowed, creating better affordability.
- Sellers may be more willing to negotiate repairs, closing costs, or other concessions.
For many buyers who delayed purchasing over the past few years, current conditions may provide an opportunity to re-enter the market with greater confidence.
What This Means for Sellers
Sellers can also benefit from today's market, provided they approach pricing strategically.
With buyer demand continuing to increase, well-maintained and accurately priced homes continue to receive strong interest. However, today's buyers are more selective and have additional options available, making preparation and pricing more important than ever.
Professional photography, thoughtful staging, accurate pricing, and targeted marketing remain essential for maximizing a home's value.
Local Expertise Matters More Than Ever
Although overall market conditions remain positive, real estate is still highly local. Market performance can vary significantly between cities, neighborhoods, school districts, and even individual communities throughout Central Texas.
Whether you're buying your first home, upgrading, downsizing, or preparing to sell, working with a knowledgeable local real estate professional can help you better understand neighborhood-specific trends, pricing strategies, and current market conditions.
Looking Ahead
As Central Texas enters the second half of 2026, the housing market continues to show encouraging signs of stability and growth. Rising home sales, strong pending transactions, balanced pricing, and steady buyer activity all point toward a market that is regaining momentum after several years of adjustment.
While economic conditions will continue to influence real estate activity, Central Texas remains one of the nation's most resilient housing markets. For both buyers and sellers, staying informed and making decisions based on local market data will be key to achieving success in the months ahead.
Austin-Round Rock-San Marcos MSA
June 2026 Sales
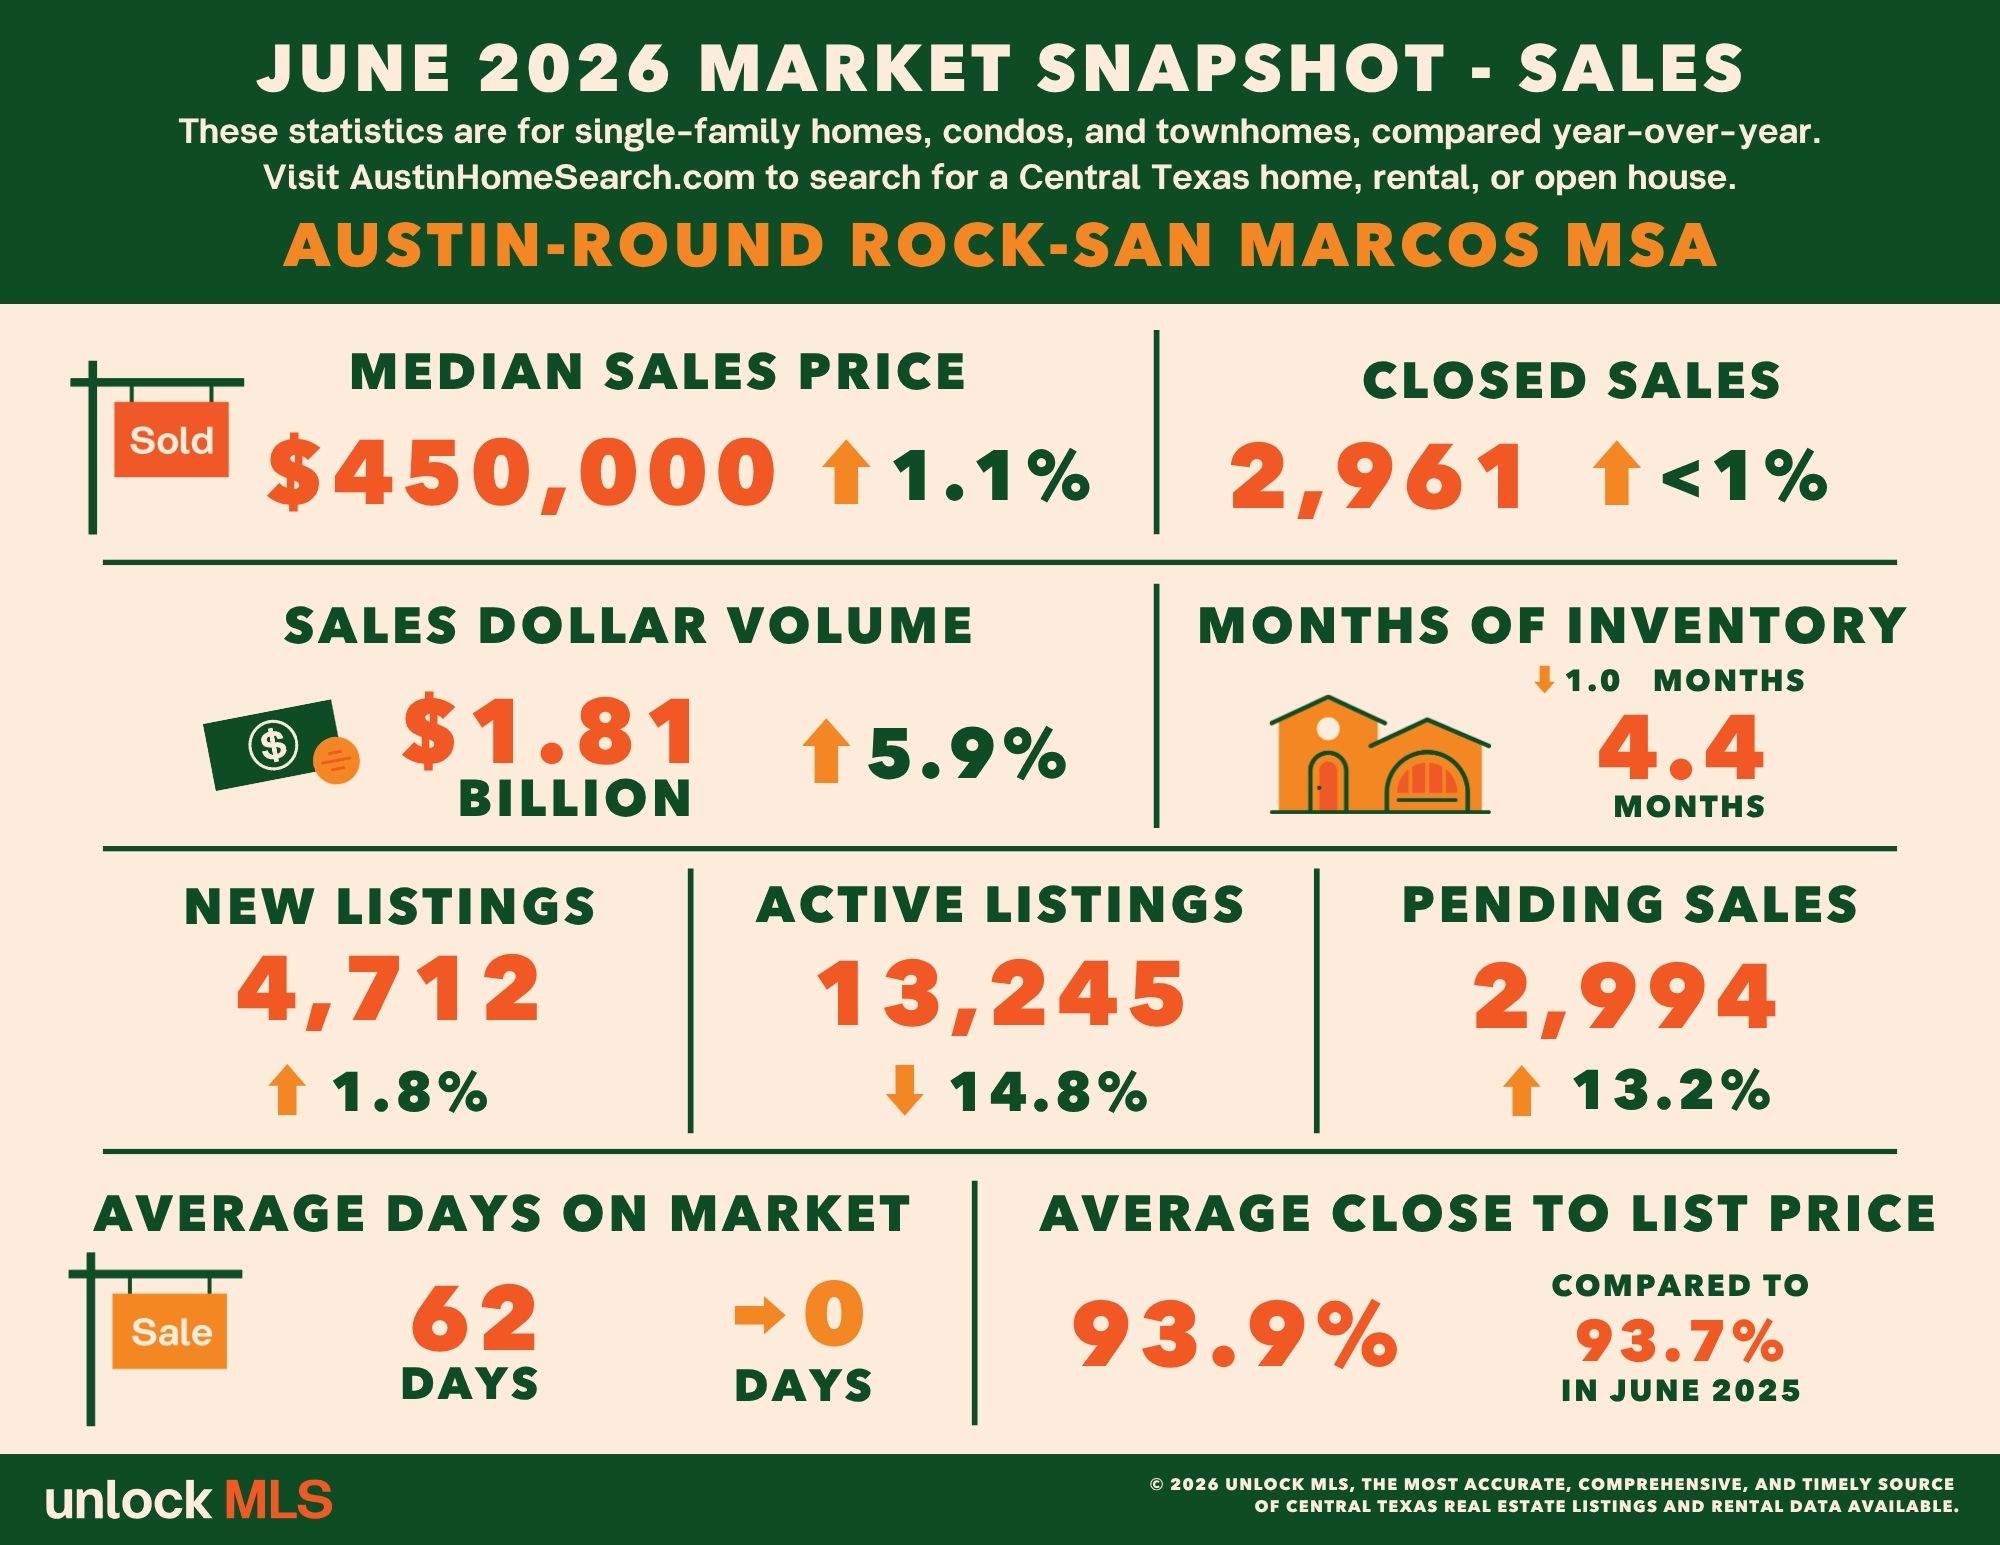
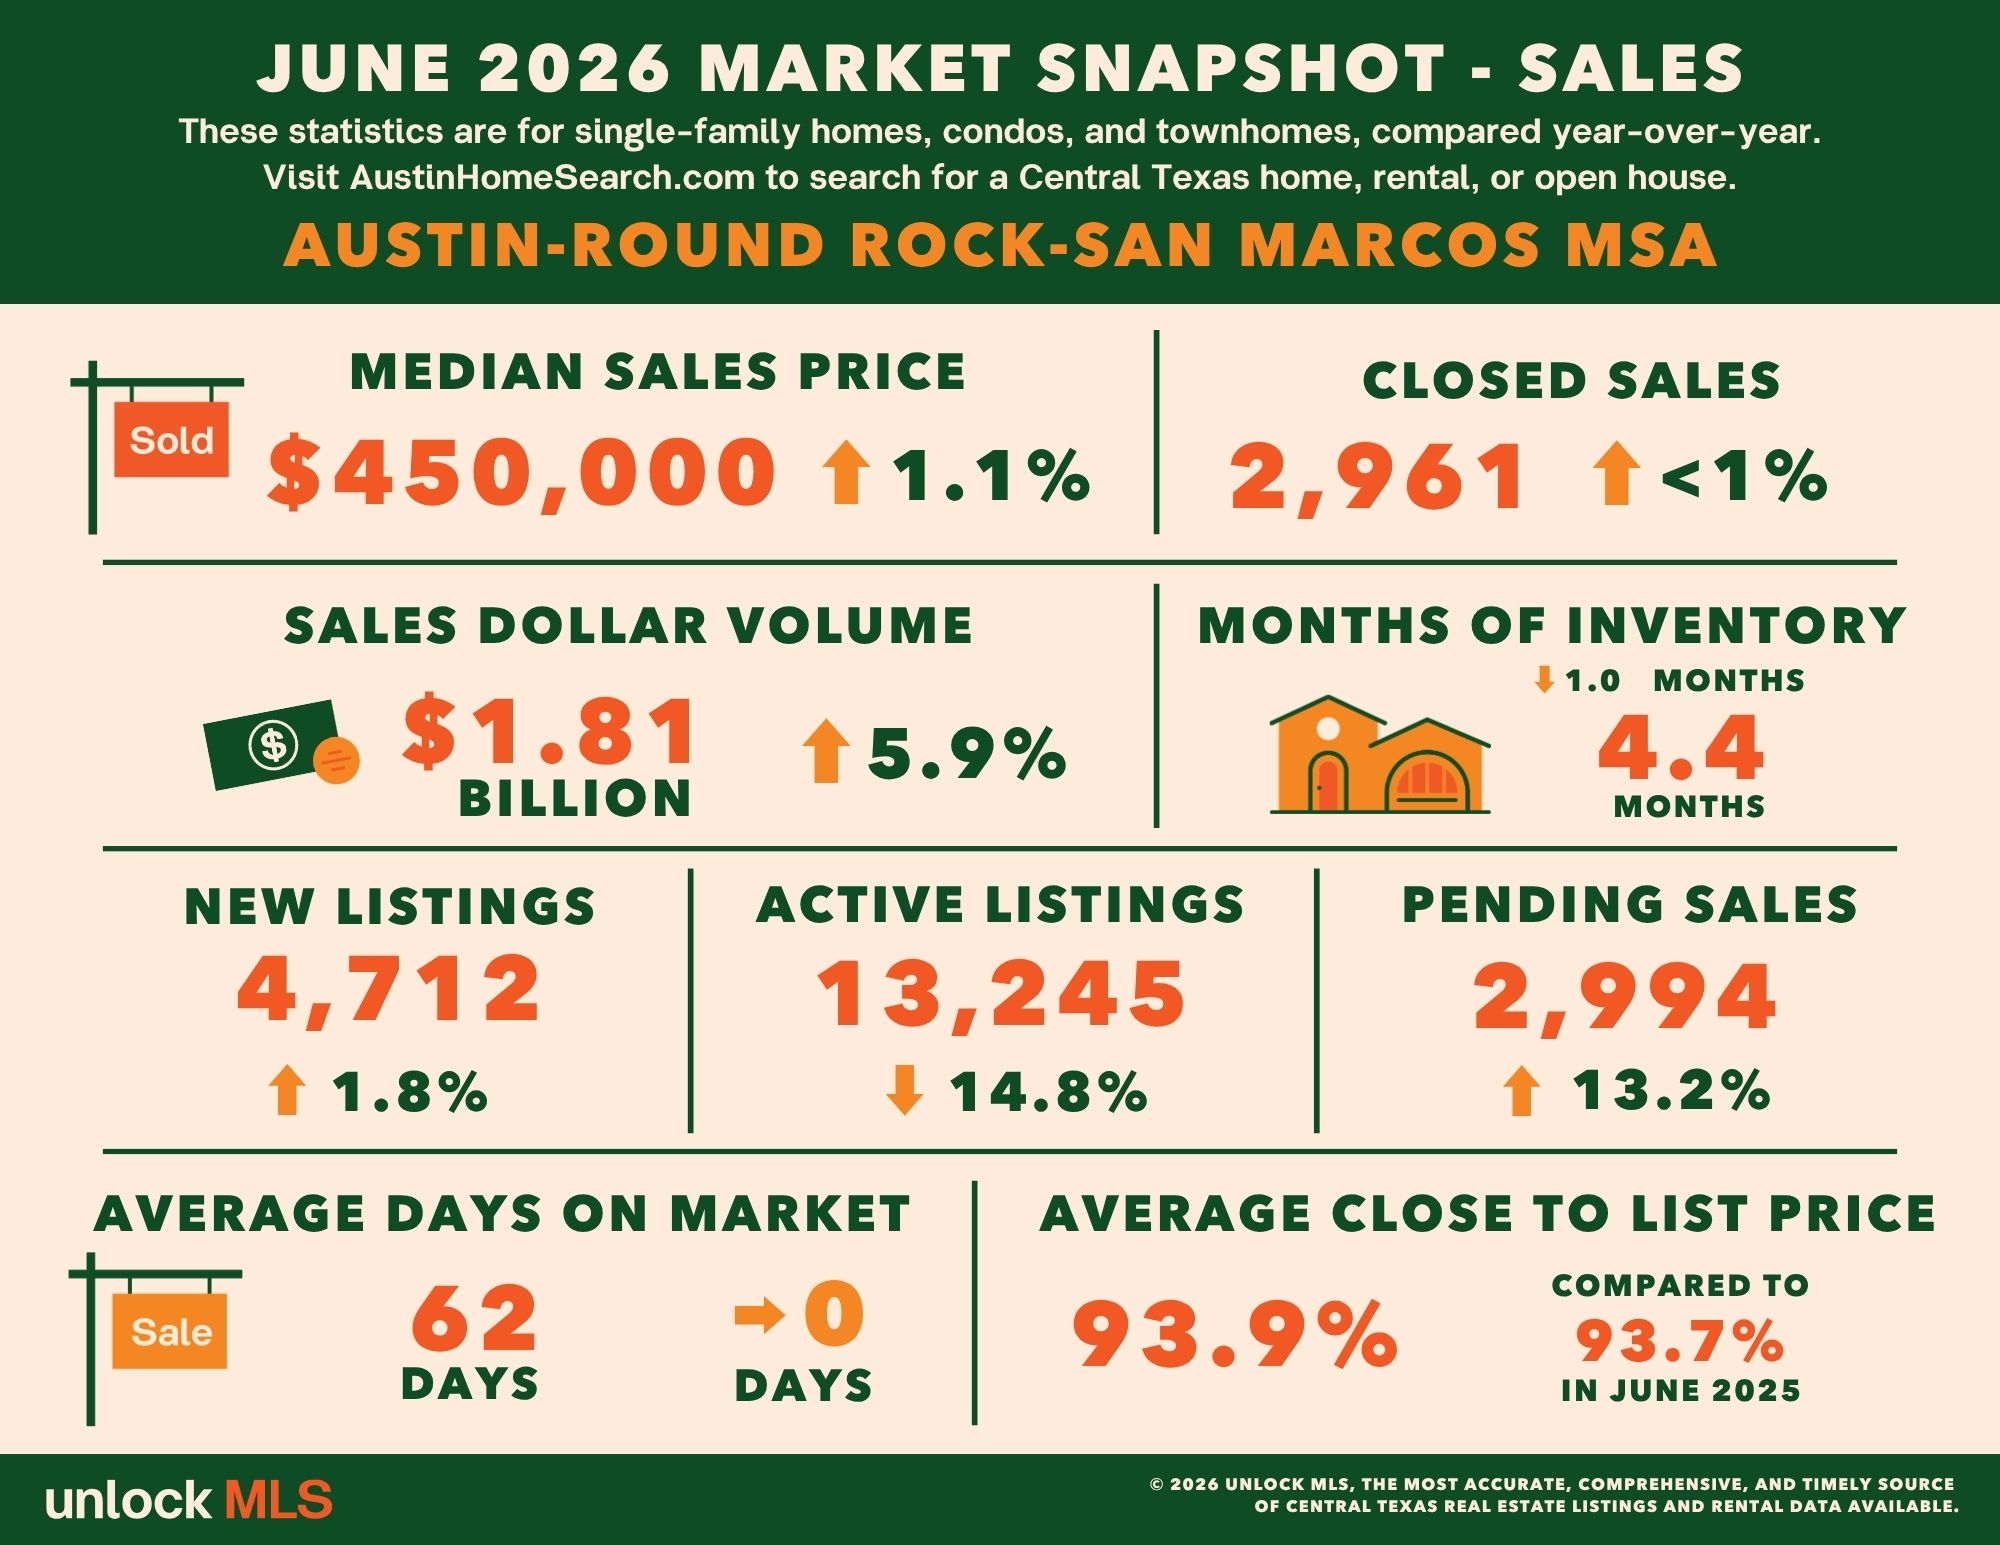
- 2,961 – Residential homes sold, 0.6% more than June 2025.
- $450,000 – Median price for residential homes, 1.1% more than June 2025.
- 4,712 – New home listings on the market, 1.8% more than June 2025.
- 13,245 – Active home listings on the market, 14.8% less than June 2025.
- 2,994 – Pending sales, 13.2% more than June 2025.
- 4.4 – Months of inventory, 1.0 months less June 2025.
- $1,814,149,897 – Total dollar volume of homes sold, 5.9% more than June 2025.
- 93.9% – Average close to list price, compared to 93.7% in June 2025.
Year to Date Sales
- 15,698 – Residential homes sold, 4.8% more than the first half of 2025.
- $425,000 – Median price for residential homes, 2.4% less than the first half of 2025.
- 28,042 – New home listings on the market, 3.3% less than the first half of 2025.
- 77,888 – Active home listings on the market, 1.8% more than the first half of 2025.
- 17,461 – Pending sales, 9.8% more than the first half of 2025.
- $8,964,335,285 – Total dollar volume of homes sold, 4.2% more than the first half of 2025.
Year to Date Leases
- 17,185 – Closed leases, 7.3% more than the first half of 2025.
- $2,100 – Median price for rent, 4.3% less than the first half of 2025.
- 21,134 – New lease listings on the market, 0.4% more than the first half of 2025.
- 25,703 – Active lease listings on the market, 4.7% less than the first half of 2025.
- 18,150 – Pending leases, 8.0% more than the first half of 2025.
- $40,113,693 – Total dollar volume of leases, 3.2% more than the first half of 2025.
City of Austin
June 2026 Sales
- 1,054 – Residential homes sold, 4.6% more than June 2025.
- $605,000 – Median price for residential homes, 3.6% more than June 2025.
- 1,665 – New home listings on the market, 3.3% less than June 2025.
- 4,665 – Active home listings on the market, 22.1% less than June 2025.
- 1,024 – Pending sales, 16.5% more than June 2025.
- 4.3 – Months of inventory, 1.7 months less than June 2025.
- $859,091,915 – Total dollar volume of homes sold, 8.1% more than June 2025.
- 94.5% – Average close to list price, compared to 93.6% in June 2025.
Year to Date Sales
- 5,396 – Residential homes sold, 6.4% more than the first half of 2025.
- $572,500 – Median price for residential homes, 1.3% less than the first half of 2025.
- 10,298 – New home listings on the market, 7.4% less than the first half of 2025.
- 26,772 – Active home listings on the market, 5.8% less than the first half of 2025.
- 6,009 – Pending sales, 11.4% more than the first half of 2025.
- $4,133,814,934 – Total dollar volume of homes sold, 5.5% more than the first half of 2025.
Year to Date Leases
- 8,993 – Closed leases, 11.0% more than the first half of 2025.
- $2,175 – Median price for rent, 5.4% less than the first half of 2025.
- 11,128 – New lease listings on the market, 3.6% more than the first half of 2025.
- 13,127 – Active lease listings on the market, 2.4% less than the first half of 2025.
- 9,446 – Pending leases, 10.0% more than the first half of 2025.
- $22,432,936 – Total dollar volume of leases, 5.0% more than the first half of 2025.
Travis County
June 2026 Sales
- 1,389 – Residential homes sold, 6.7% more than June 2025.
- $542,000 – Median price for residential homes, 4.0% more than June 2025.
- 2,229 – New home listings on the market, 0.6% more than June 2025.
- 6,439 – Active home listings on the market, 17.7% less than June 2025.
- 1,356 – Pending sales, 16.7% more than June 2025.
- 4.7 – Months of inventory, 1.4 less than June 2025.
- $1,056,287,319 – Total dollar volume of homes sold, 13.1% more than June 2025.
- 94.2% – Average close to list price, compared to 93.6% in June 2025.
Year to Date Sales
- 7,092 – Residential homes sold, 6.5% more than the first half of 2025.
- $499,900 – Median price for residential homes, 2.0% less than the first half of 2025.
- 13,721 – New home listings on the market, 4.1% less than the first half of 2025.
- 37,488 – Active home listings on the market, 0.8% less than the first half of 2025.
- 7,919 – Pending sales, 12.7% more than the first half of 2025.
- $4,991,259,152 – Total dollar volume of homes sold, 6.2% more than the first half of 2025.
Year to Date Leases
- 10,039 – Closed leases, 9.4% more than the first half of 2025.
- $2,150 – Median price for rent, 4.4% less than the first half of 2025.
- 12,628 – New lease listings on the market, 4.6% more than the first half of 2025.
- 15,766 – Active lease listings on the market, 0.5% less than the first half of 2025.
- 10,544 – Pending leases, 8.9% more than the first half of 2025.
- $24,906,991 – Total dollar volume of leases, 3.9% more than the first half of 2025.
Williamson County
June 2026 Sales
- 1,001 – Residential homes sold, 4.3% more than June 2025.
- $426,800 – Median price for residential homes, 0.5% more than June 2025.
- 1,514 – New home listings on the market, 5.9% more than June 2025.
- 3,999 – Active home listings on the market, 14.0% less than June 2025.
- 1,037 – Pending sales, 14.5% more than June 2025.
- 3.7 – Months of inventory, 1.2 less than June 2025.
- $493,204,611 – Total dollar volume of homes sold, 5.3% more than June 2025.
- 93.8% – Average close to list price, compared to 94.1% in June 2025.
Year to Date Sales
- 5,410 – Residential homes sold, 7.0% more than the first half of 2025.
- $408,000 – Median price for residential homes, 2.9% less than the first half of 2025.
- 8,797 – New home listings on the market, 0.9% less than the first half of 2025.
- 23,666 – Active home listings on the market, 4.2% more than the first half of 2025.
- 5,998 – Pending sales, 12.2% more than the first half of 2025.
- $2,547,917,665 – Total dollar volume of homes sold, 5.0% more than the first half of 2025.
Year to Date Leases
- 5,271 – Closed leases, 4.4% more than the first half of 2025.
- $2,099 – Median price for rent, 2.3% less than the first half of 2025.
- 6,110 – New lease listings on the market, 7.4% less than the first half of 2025.
- 6,796 – Active lease listings on the market, 15.2% less than the first half of 2025.
- 5,600 – Pending leases, 6.4% more than the first half of 2025.
- $11,355,587 – Total dollar volume of leases, 2.0% more than the first half of 2025.
Hays County
June 2026 Sales
- 390 – Residential homes sold, 22.8% less than June 2025.
- $400,000 – Median price for residential homes, 9.0% more than June 2025.
- 634 – New home listings on the market, 9.3% less than June 2025.
- 1,819 – Active home listings on the market, 13.0% less than June 2025.
- 409 – Pending sales, 0.7% more than June 2025.
- 4.8 – Months of inventory, 0.5 months more than June 2025.
- $195,640,921 – Total dollar volume of homes sold, 19.2% less than June 2025.
- 93.6% – Average close to list price, compared to 93.2% in June 2025.
Year to Date Sales
- 2,226 – Residential homes sold, 5.2% less than the first half of 2025.
- $370,573 – Median price for residential homes, 0.7% less than the first half of 2025.
- 3,708 – New home listings on the market, 9.1% less than the first half of 2025.
- 10,789 – Active home listings on the market, 1.1% less than the first half of 2025.
- 2,456 – Pending sales, 3.5% less than the first half of 2025.
- $1,075,305,200 – Total dollar volume of homes sold, 4.9% less than the first half of 2025.
Year to Date Leases
- 1,414 – Closed leases, 2.2% more than the first half of 2025.
- $1,995 – Median price for rent, flat compared to the first half of 2025.
- 1,769 – New lease listings on the market, 1.2% less than the first half of 2025.
- 2,251 – Active lease listings on the market, 7.1% less than the first half of 2025.
- 1,522 – Pending leases, 6.3% more than the first half of 2025.
- $3,003,911 – Total dollar volume of leases, 0.5% more than the first half of 2025.
Bastrop County
June 2026 Sales
- 137 – Residential homes sold, 0.7% more than June 2025.
- $344,900 – Median price for residential homes, 6.8% less than June 2025.
- 234 – New home listings on the market, 3.1% more than June 2025.
- 749 – Active home listings on the market, 5.4% less than June 2025.
- 140 – Pending sales, 14.8% more than June 2025.
- 6.6 – Months of inventory, 0.2 months more than June 2025.
- $54,578,691 – Total dollar volume of homes sold, 3.5% less than June 2025.
- 93.5% – Average close to list price, compared to 94.6% in June 2025.
Year to Date Sales
- 703 – Residential homes sold, 3.2% more than the first half of 2025.
- $339,990 – Median price for residential homes, 2.9% less than the first half of 2025.
- 1,324 – New home listings on the market, 2.1% less than the first half of 2025.
- 4,571 – Active home listings on the market, 11.7% more than the first half of 2025.
- 794 – Pending sales, 6.9% more than the first half of 2025.
- $270,336,996 – Total dollar volume of homes sold, 0.7% less than the first half of 2025.
Year to Date Leases
- 313 – Closed leases, 11.8% more than the first half of 2025.
- $1,900 – Median price for rent, 2.6% less than the first half of 2025.
- 453 – New lease listings on the market, 8.4% more than the first half of 2025.
- 617 – Active lease listings on the market, 27.7% more than the first half of 2025.
- 336 – Pending leases, 14.3% more than the first half of 2025.
- $603,754 – Total dollar volume of leases, 7.4% more than the first half of 2025.
Caldwell County
June 2026 Sales
- 44 – Residential homes sold, 12.8% more than June 2025.
- $260,495 – Median price for residential homes, 10.2% less than June 2025.
- 101 – New home listings on the market, 74.1% more than June 2025.
- 239 – Active home listings on the market, 36.6% more than June 2025.
- 52 – Pending sales, 4.0% more than June 2025.
- 5.6 – Months of inventory, 0.9 months more than June 2025.
- $14,438,355 – Total dollar volume of homes sold, 15.8% more than June 2025.
- 93.1% – Average close to list price, compared to 91.1% in June 2025.
Year to Date Sales
- 267 – Residential homes sold, 17.1% more than the first half of 2025.
- $242,000 – Median price for residential homes, 19.3% less than the first half of 2025.
- 492 – New home listings on the market, 26.2% more than the first half of 2025.
- 1,374 – Active home listings on the market, 36.0% more than the first half of 2025.
- 294 – Pending sales, 21.5% more than the first half of 2025.
- $79,516,272 – Total dollar volume of homes sold, 7.5% more than the first half of 2025.
Year to Date Leases
- 148 – Closed leases, 20.3% more than the first half of 2025.
- $1,700 – Median price for rent, 5.0% less than the first half of 2025.
- 174 – New lease listings on the market, 5.5% more than the first half of 2025.
- 273 – Active lease listings on the market, 46.8% more than the first half of 2025.
- 148 – Pending leases, 14.7% more than the first half of 2025.
- $243,450 – Total dollar volume of leases, 19.5% more than the first half of 2025.
For more information or to download the June and Mid-Year 2026 Central Texas Housing Market Report, visit UnlockMLS.com/Stats.

Dyron Taylor
Broker I Owner GRI, ABR, SFR | Taylor Realty Group | Keller Williams Realty Austin
or another way